
The third part of our Report Generator Guidance explains the main part of linking together the PPT template and the elements from the dashboard.
Required role: Report Creator
Element ID -> Alt Text
Part 1. Dashboard
Each dashboard element has a specific name (ID), to allow the dashboard data to populate the template's placeholders.
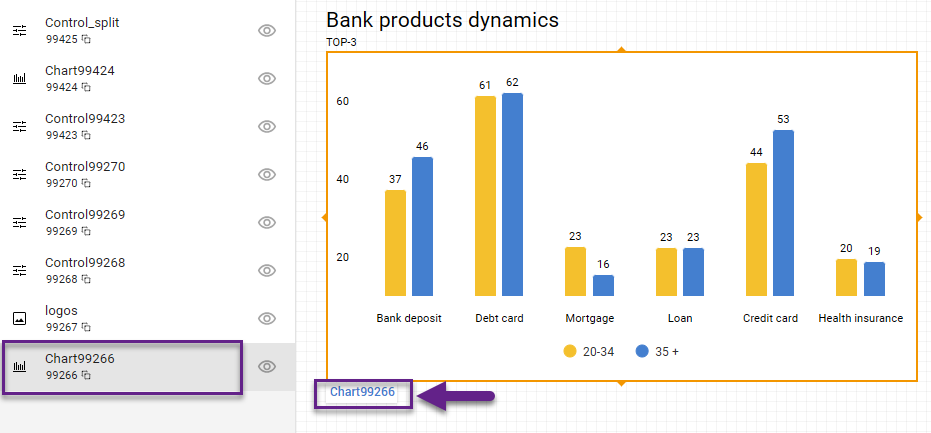
The element name is used as a reference point to link the widget to the corresponding placeholder in PowerPoint within Alt Text. Multiple placeholders can be connected to one dashboard widget/element name.
Once the element name is added to the Alt Text of the placeholder, PowerPoint can connect to the dashboard and retrieve the data associated with that widget.
You can edit the names of elements, but make sure to follow these rules:
-
Ensure that each element ID is unique.
-
Use Latin letters or numbers.
-
Use dashes or underscores instead of spaces.
-
Use a streamlined pattern to keep name consistency.
See the video below for step-by-step instructions:
Part 2. Template
-
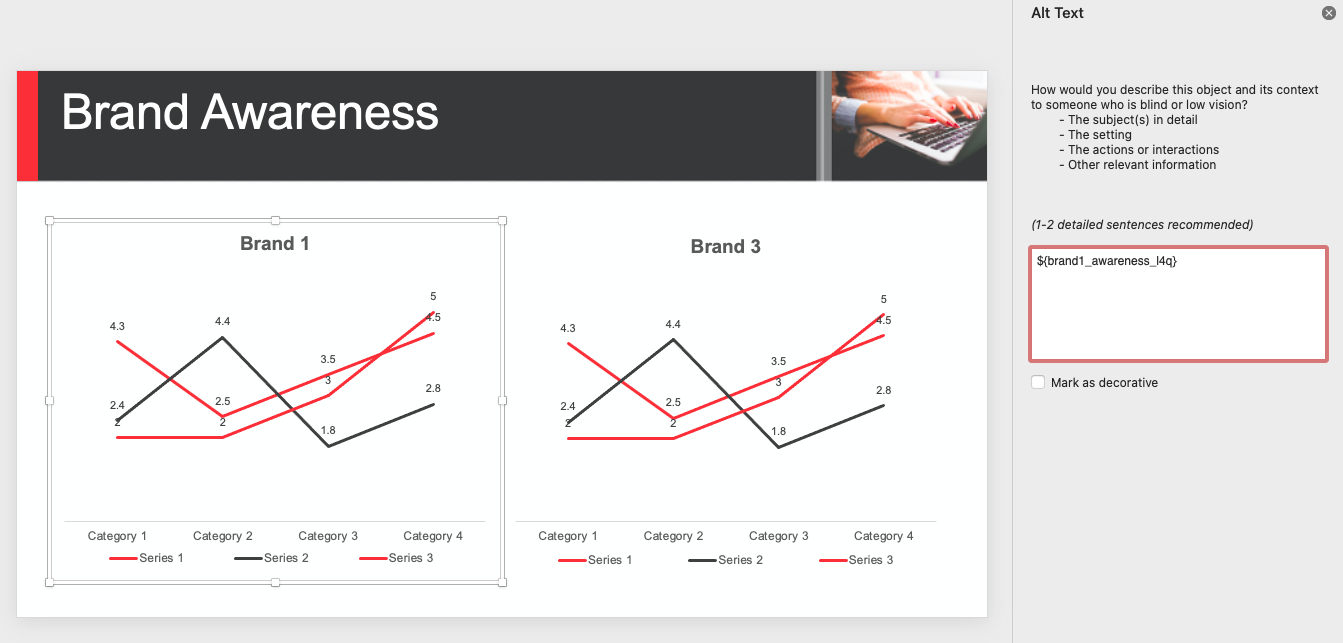
For charts, right-click on the block -> Alt Text.
Insert the chart ID from the dashboard into the Alt Text box as follows: ${element_name}. -
For images, right-click on the block -> Alt Text.
Insert the image ID from the dashboard into the Alt Text box as follows: ${element_name}. -
In the text box, you can enter the element ID directly with the same syntax. For example, “Ad campaign ${Control_brand} among ${Control_audience}”. The corresponding values of these controls will replace the template text in reports.
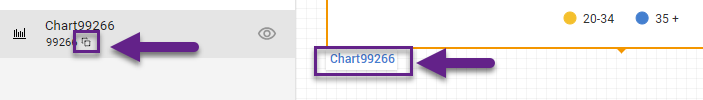
To avoid any errors and typos, use the copy option: click either on the ID under the element or on the ‘copy’ icon in the elements menu.
Ensure that you use curly brackets {…}.
Use our advanced guide to create well-structured templates.
In text form, you can insert not only individual control options but also the contents of charts or tables from the dashboard. This makes it easy to add questions or sample sizes without manually typing them onto the slide.
How to add a sample sizes table (example).
-
Copy the ID of the previously created and named sample size table.
-
Paste it as text anywhere on the slide that you want the text to appear. Enclose it within these symbols ${ID}.
-
Edit the font, text size, and color as you would like them to appear.
-
Copy and paste the text box onto all relevant slides.
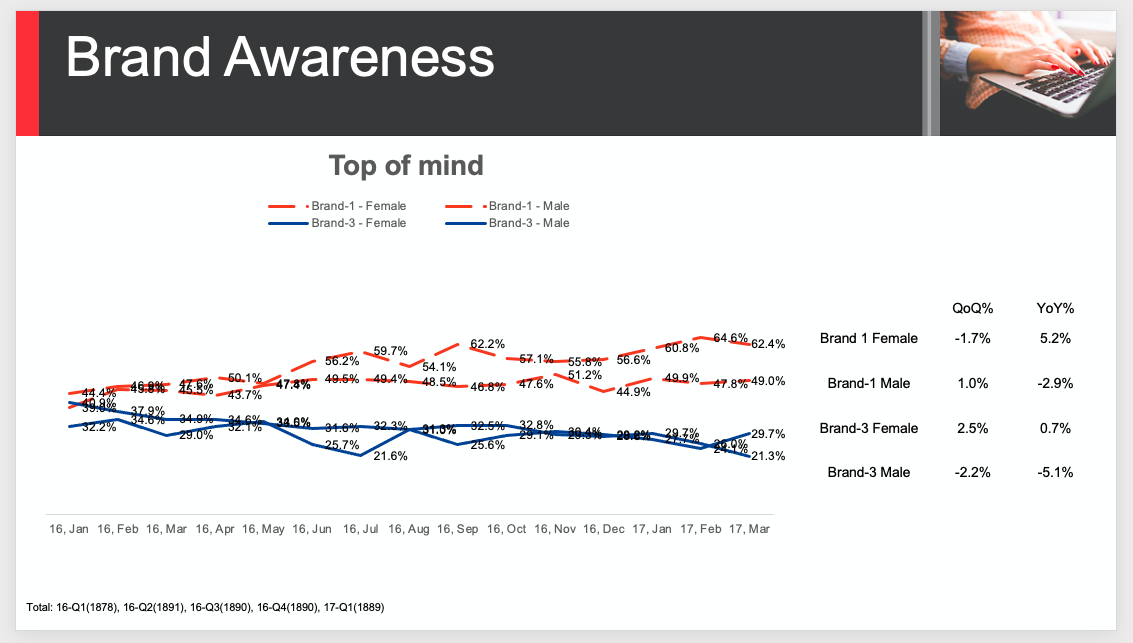
The image below shows the first slide of a downloaded report with the sample size table shown in the bottom-left corner.
Once the template is ready, it needs to be uploaded to the dashboard to enable downloading the final report.