Your crosstab can be turned into a visually impactful trend report using a line chart.
The most common situation is comparing data from different waves of research, and the line chart will show the dynamics over time, although there are other situations for its application.
DataTile has normal and spline versions of line charts.
-
Switch to Chart mode
-
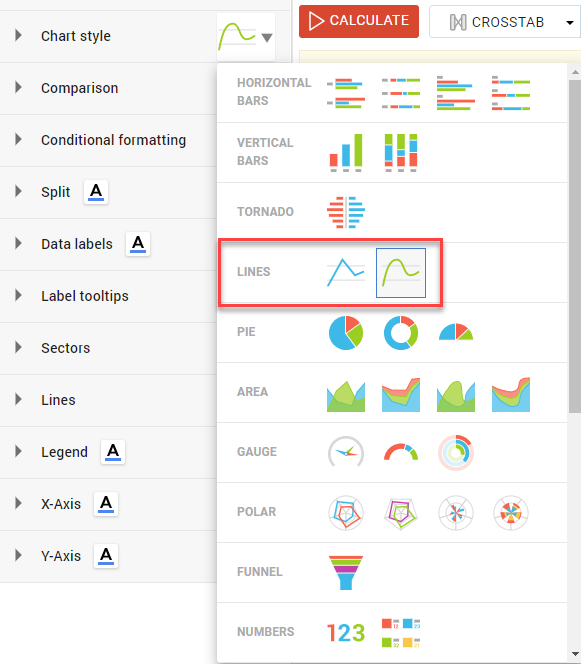
Click on the chart icon and choose the line chart.
-
In the line chart menu, turn on Data labels and customize the data labels settings. You can edit the size and color, adjust the position of labels, and add a Value prefix or Value suffix.
-
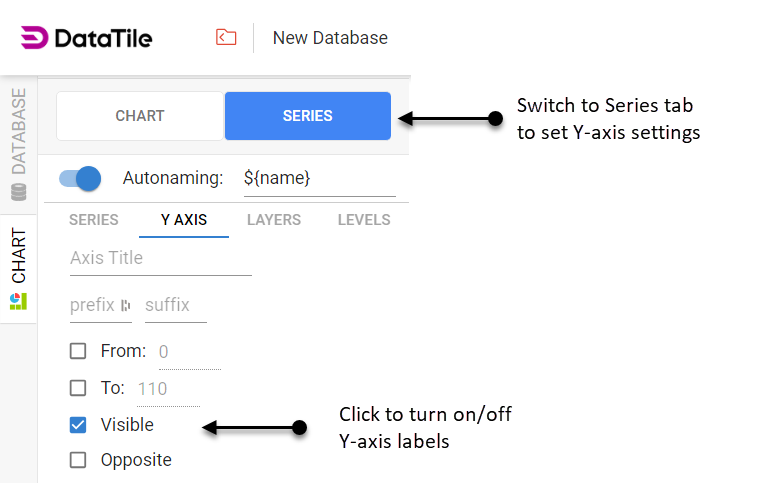
To prevent having a double axis, you can switch off the y-axis (scale on the left-hand-side of the chart) by going to the Series menu, clicking on the Y-axis then deselecting the checkbox Visible.
You can also customize the significance testing on your chart by clicking on Comparison. You can adjust the trend shift and also add a Tailing change for a more explicit demonstration of the trend dynamics.