The brief February digest introduces several new features, mostly focused on enhancing and streamlining calculations in both the crosstab and the dashboard. Here you’ll find a description of the newly added options for Proxy controls, new MATH formulas, enhancements to the Moving average, and updates to the user panel.
DIV and DIFF added for Proxy Controls
The Proxy Control continues to receive new functionality. The new capabilities for connecting controls through proxy are DIV and DIFF.
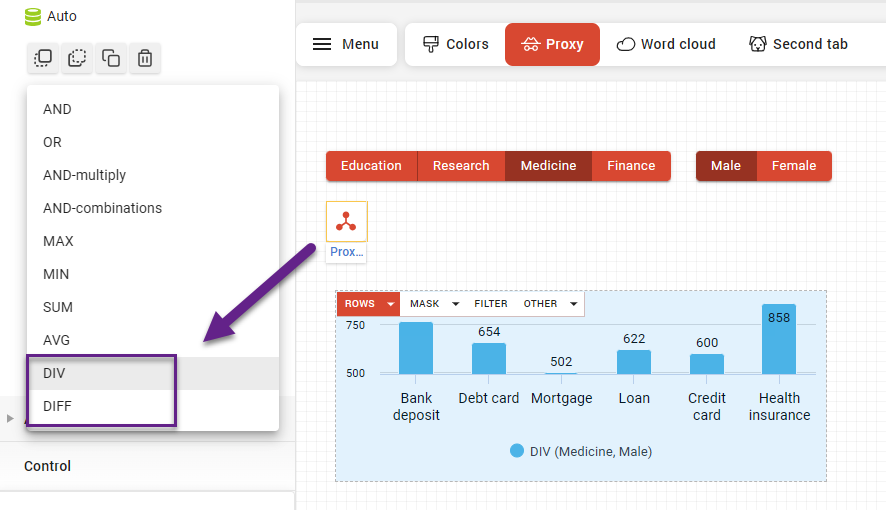
Now, after assigning the controls with proper options, you can calculate the absolute and relative differences between the selected options. The calculation logic proceeds from left to right (top to bottom) based on the position of the controls on the dashboard.
Proxy title as a variable for MATH
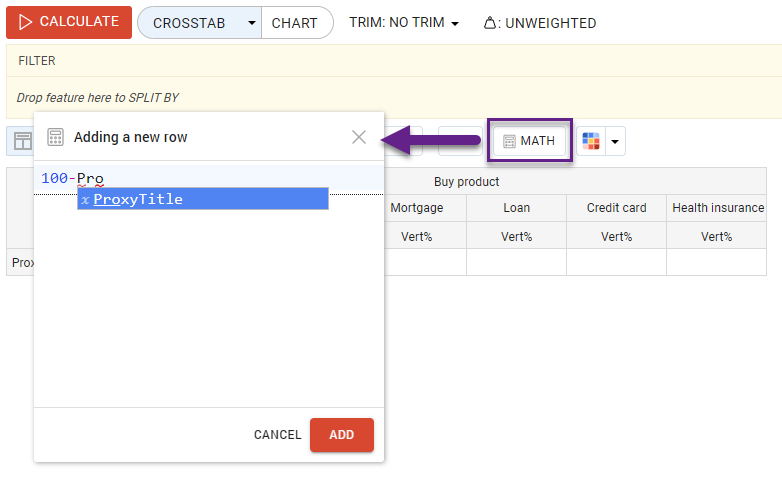
The next useful feature when working with Proxy control is the possibility of using its title as a variable in a mathematical formula.
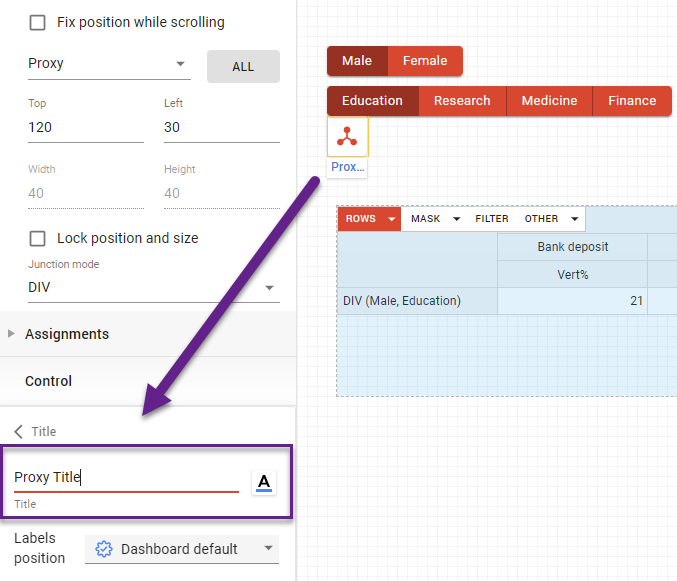
Once the proxy has been assigned to the chart, you can switch to crosstab editing mode and use the proxy title as a variable in a mathematical expression. This is efficient and convenient because when using a regular control, the option labels in the crosstab would also change, whereas the proxy remains constant regardless of the options selected on its associated controls.
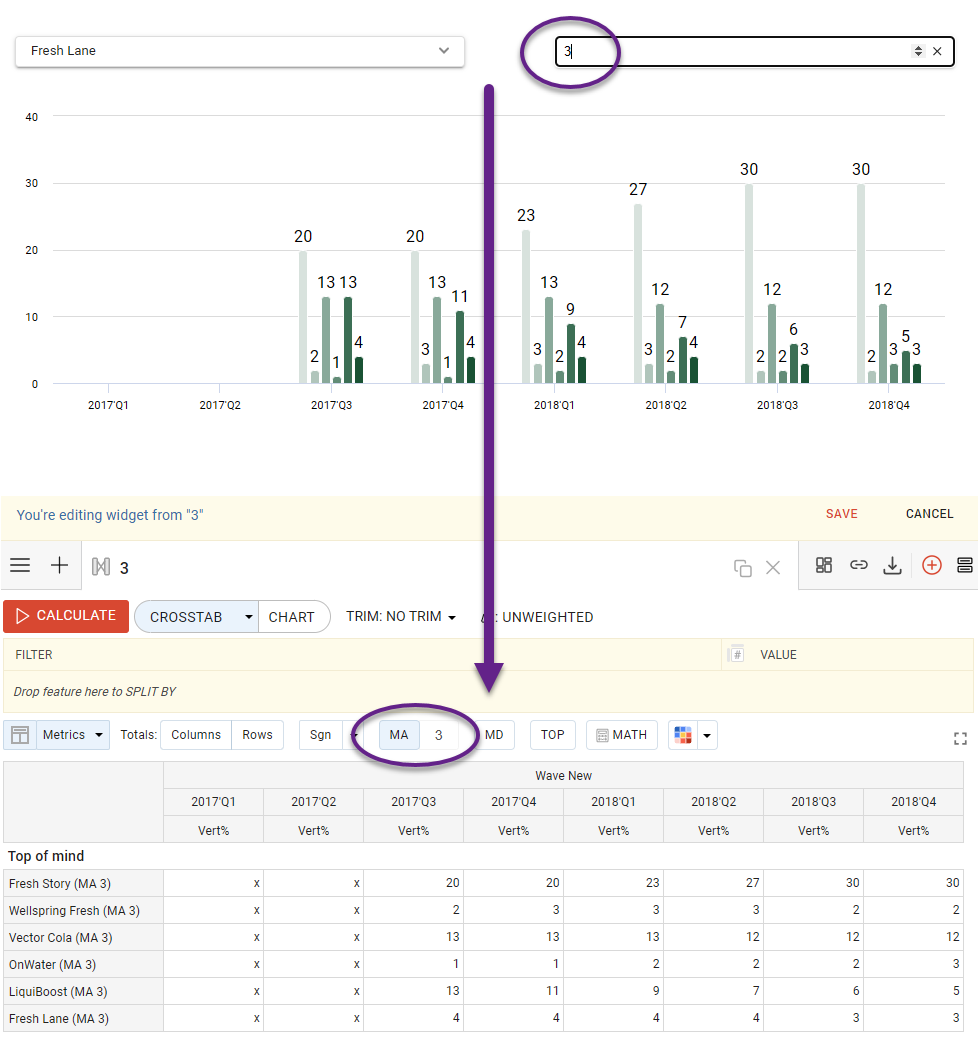
Expanded functionality for Moving Average
The moving average can be enabled and computed both in the crosstab and on the dashboard. Previously, these were functionally independent entities. Now, if you enable MA on the dashboard, calculations are preserved in the crosstab as well. This enables seamless and accurate operation of the comparison feature and others.
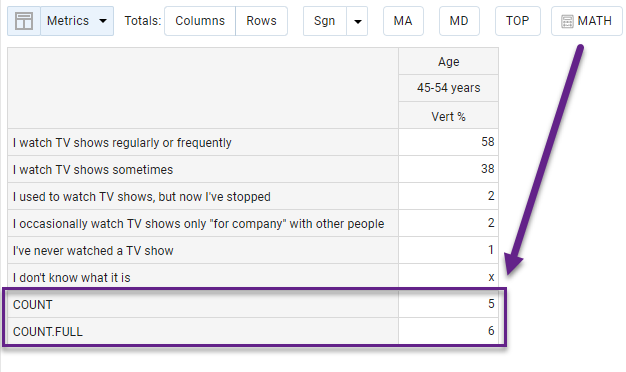
AVG.FULL and COUNT.FULL functions in mathematics
Using AVG.FULL and COUNT.FULL includes significant missing values that may result from applied filters.
For example, if there are 6 attitude responses in the database but a specific group (e.g., age 40-49) provided only 5, then:
-
COUNT will return 5;
-
COUNT.FULL will return 6, accounting for the missing value.
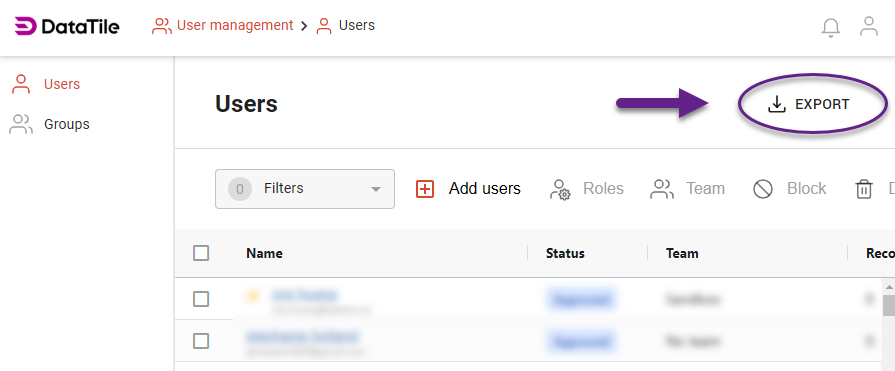
A few changes to the user panel
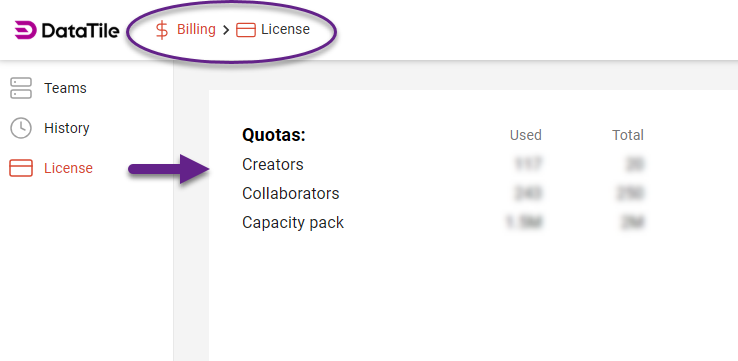
For server administrators, several management improvements have been made. You can now download a detailed list of users. The ‘Export’ button is in the user panel's upper right corner. Previously, a statistics button was displayed there, but don't worry - the statistics feature is still available.
To view server usage statistics, navigate to Billing → License.