
The Moving Average, also known as a Rolling Average, smooths data by averaging data points within a defined window. This calculation can be incorporated into both ad hoc crosstab reports and dashboards, enabling viewers to specify the window size.
The window defines the number of preceding data points used in each average calculation, effectively "rolling" across the underlying table's chosen dimension — either rows or columns. Each point of a Moving Average is the effective average of n (window size) consecutive data points of the original underlying series to the left, starting from the corresponding point.
Rolling average in the Crosstab
If you don't see the ‘Rolling’ button, go to Project Settings → Settings → Features Availability, and tick the corresponding checkbox.
To calculate the moving average in a crosstab or grid report
-
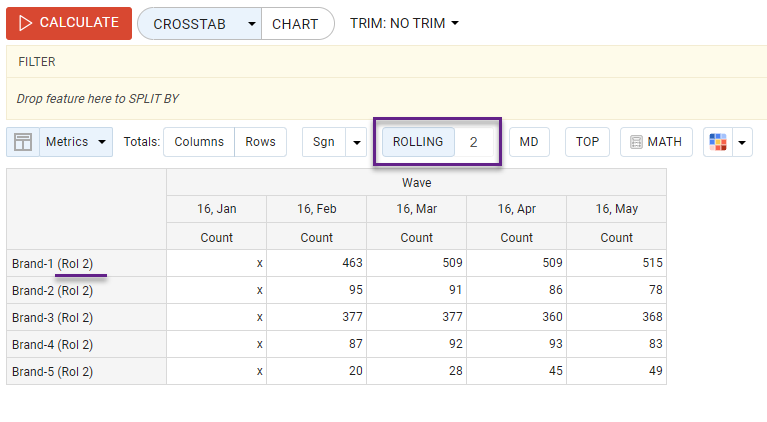
Press the ‘Rolling’ button;
-
Enter the window size in the field that appears to the right of the button;
-
Click CALCULATE
Note that in adhoc reports, rolling always applies to the column, assuming that series are in rows.
A Moving Average/Rolling series is inherently (n-1) points shorter than the original series from which it is calculated. This is because the first (n-1) points lack the complete window of size n for the calculation.
Dynamic Rolling on a Dashboard
Moving Average applies to one of the table's dimensions (rows or columns) backing the chart.
You can allow users to enter the rolling window size for a chart on the dashboard.
-
Click on

-
On the left panel, change its type to Integer.
-
Set minimum, maximum, and default values for the window size.
-
Assign this input to the rows or columns of the chart to enable rolling along this dimension.
Rolling vs MD assignments
Depending on the strategy you choose, when assigning a control on the dashboard, you can select:
-
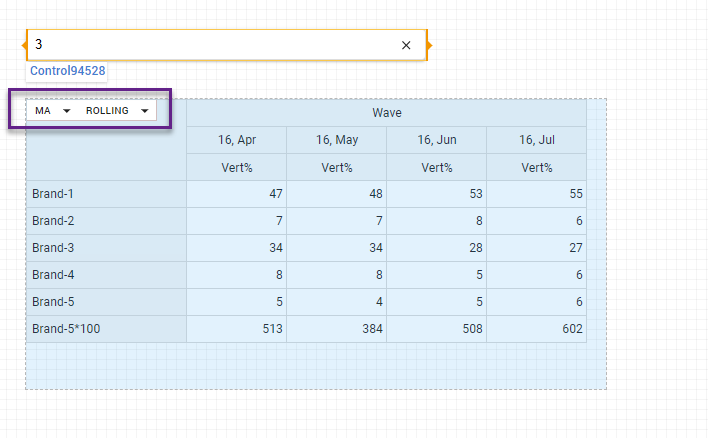
MA: the moving average will be calculated first, and then the mathematics used in the chart will be applied to the resulting values.
-
Rolling: the mathematics will be applied first, and then the moving average will be calculated on the resulting values (similar to how it's done in the cross-tab).
Rolling Mode
Moving Average calculation works in two modes:
![]()
![]()
To change Rolling Mode:
-
In edit mode, select the chart with the rolling trend.
-
Expand the Assignment section on the left panel and locate the Moving Average (MA) assignment.
-
Here we see MA COLS, meaning that rolling applies along columns.
-
Click on the switcher next to it to switch modes.