
What is Codebook?
A codebook is a structured Excel file (.dtcb.xlsx) that defines how your data should look and behave in DataTile.
Tip: Most one-off projects are faster to tidy in the UI; reserve codebooks for repeatable processing and distribution.
It can:
-
Standardise variable names and labels
-
Define multi-response sets and question arrays
-
Organise variables into folders
-
Control visibility of variables
-
Translate data to a clean, consistent data map.
Think of it as a reproducible data map: you set the rules once, reuse them across projects/waves/datasets, and get consistent outputs every time.
→ You can view and download the sample codebook v2 used in this manual.
What’s New in Version 2
The Codebook v2 layout is the result of our team's extensive experience in working with international trackers, benchmark databases, and global syndicated studies.
This format is succinct, yet human-friendly and versatile.
-
Saves time by a magnitude on the creation and maintenance of the data map
-
Facilitates consistency of naming and brand lists
-
Reduces human errors by reusing the definitions
-
Reduces the size of the data map through patterns and removing repetitions
Key highlights
-
New capabilities – codebook v2 is a much more succinct and efficient way to describe a data map. It supports naming patterns, variable measures, new multi-response declarations, and other syntactic sugar.
-
Separation of variables and categories – The declarations of variables and value labels are separated in different worksheets, namely
VARIABLESandVALUES, making them easier to navigate, observe, and maintain. -
Incremental declaration – when no codebook is provided, DataTile derives a codebook from the data file by analysing its metadata, types of the values, etc. User-provided codebook works as a patch, overriding the default metadata extracted from the file. It’s not necessary to supply a codebook describing the entire database. Short partial codebooks can be used to update individual variables, categories, and labels.
-
Intuitive terms and column names – the first version of the codebook was purely an internal tool that was exposed for use by our clients. The new syntax uses widely accepted terminology in survey data processing, reducing learning barriers and making the overall framework more intuitive.
Old names from v1 are supported as aliases for new terms, where relevant, to ensure backward compatibility.
Codebook v2 is the primary version from August 2025. The previous version is deprecated, meaning new structures, syntax, and functionality will not be implemented for v1 but will remain available until April 2026.
Why use a codebook (and when)?
Creating a codebook is optional. For one-off uploads—such as ad hoc studies or the initial setup of a tracker—you can prepare and tidy your database more quickly using the DataTile interface, without the need to build a codebook manually.
To save time, avoid building a codebook manually from scratch. Instead, upload your data file to create a new database in DataTile, review and reorganise the schema using the UI, and then export the resulting codebook for any further manual refinements.
Codebooks offer a clear advantage when you need to repeat data processing steps or distribute data consistently across multiple projects or teams. Here are the most common use cases for codebooks:
-
Syndicated databases – Managing and distributing syndicated data becomes far more efficient with a structured codebook that includes reusable dictionaries and naming patterns. What could otherwise be hundreds of thousands of mapping rows can be condensed into just a few hundred lines.
-
Merging multiple datasets – Combining different datasets into a single benchmark database is often complex and costly, delaying new product launches. For instance, a media brand can consolidate years of ad test results into one benchmark database to improve targeting and campaign effectiveness. The DataTile codebook simplifies this process, making it faster, more consistent, and easier to maintain.
-
Standardised delivery – Codebooks facilitate the consistent delivery of recurring study types or methodologies, enabling automated report generation and streamlined data distribution across markets while reducing operational costs.
-
Integration with external platforms – Online panels, fieldwork providers, and survey platforms can use DataTile as an OEM data delivery solution. By uploading collected data along with the associated metadata, they can enable automated reporting and self-service analytics for their clients.
-
Validation and quality control – Large tracking programmes that collect data across multiple markets and suppliers benefit from early schema validation. With a DataTile codebook, requirements are clearly defined, and each incoming dataset is automatically checked against the expected structure - minimising errors, improving reliability, and speeding up delivery.
If you’re planning a new data product and facing challenges with data processing, harmonisation, or report automation, don’t hesitate to reach out to us - or schedule a consultation with our experts here.
How to Apply a Codebook
You can apply a codebook in several ways – either manually through the DataTile interface or programmatically via the API:
-
When creating a new database in DataTile.
-
When appending new data to an existing database in DataTile.
-
When reloading data in an existing database in DataTile.
-
When importing a codebook, import it into an existing database directly to update or refine metadata without uploading a data file.
Supply Codebook with Data File
Creation, append, and reload operations involve changes to the data within a database; therefore, the codebook can be supplied together with the data file.
To provide a codebook and a data file (e.g. *.sav, *.zsav) in one upload:
-
Rename the codebook file to include the secondary extension
*.dtcb.xlsx. The “dtcb” tag stands for “DataTile codebook” and allows the platform to identify it automatically. -
Zip both files – the data file and the renamed codebook – into a single archive.
-
Upload the zip bundle to DataTile. DataTile will recognise the codebook by its
*.dtcb.xlsxextension and apply it during the loading process.
Codebook Import
To download a codebook from an existing database, go to Settings → META-EDITOR and select the Download codebook option from the menu.
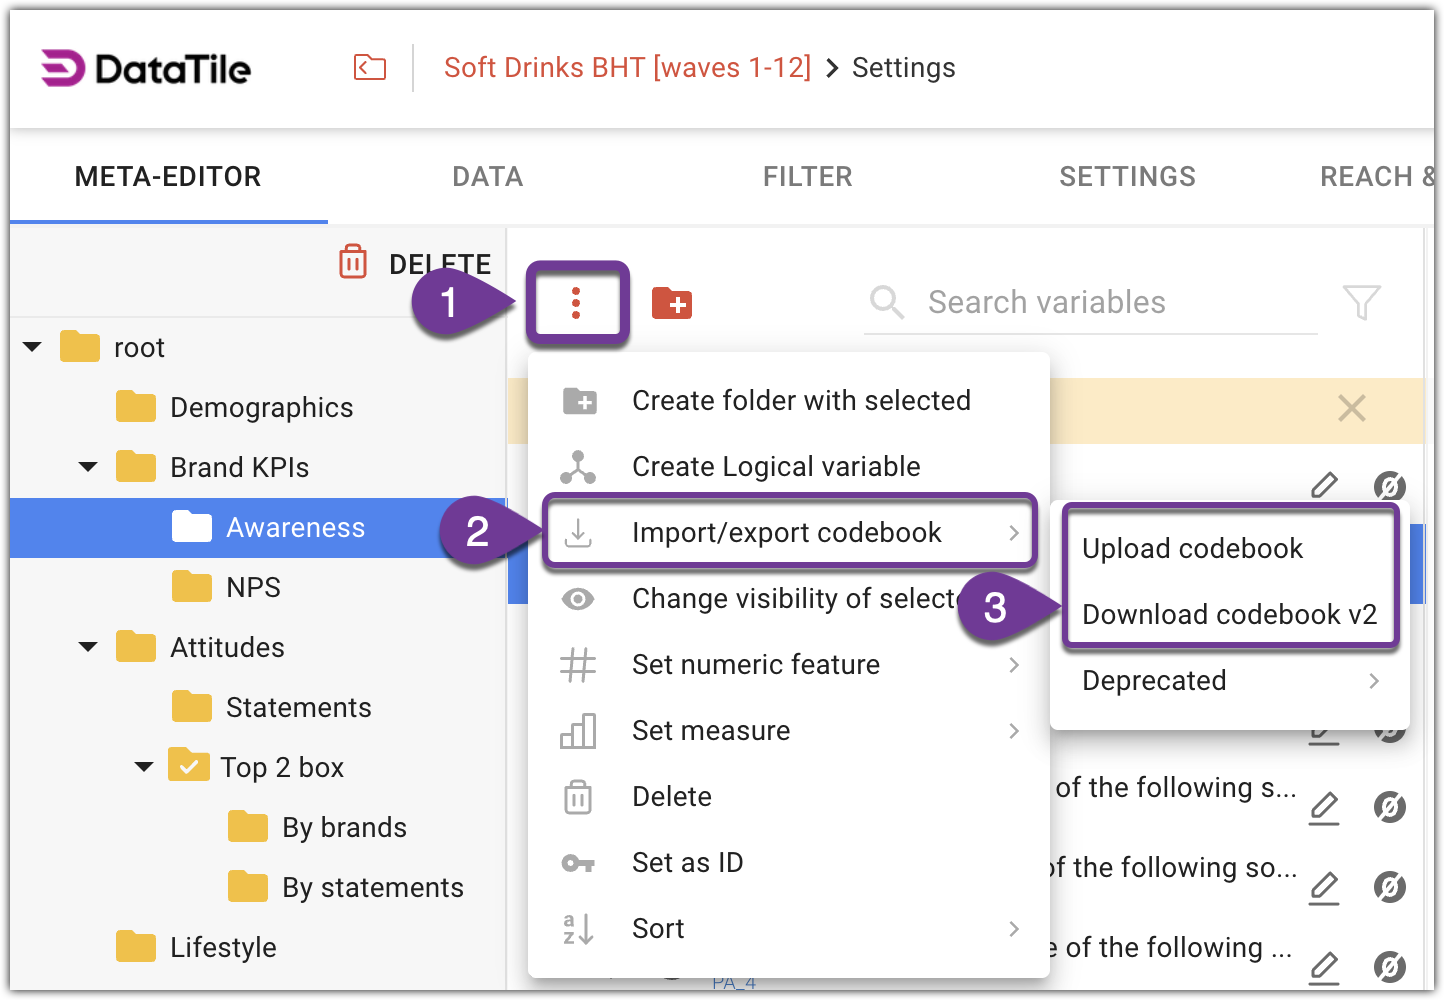
To update a database, import the revised codebook using the Upload codebook menu option.
Older versions of the codebook can also be uploaded through the same menu. DataTile automatically detects the codebook version based on its internal structure and applies it accordingly.
Codebook v2 Structure and Layout
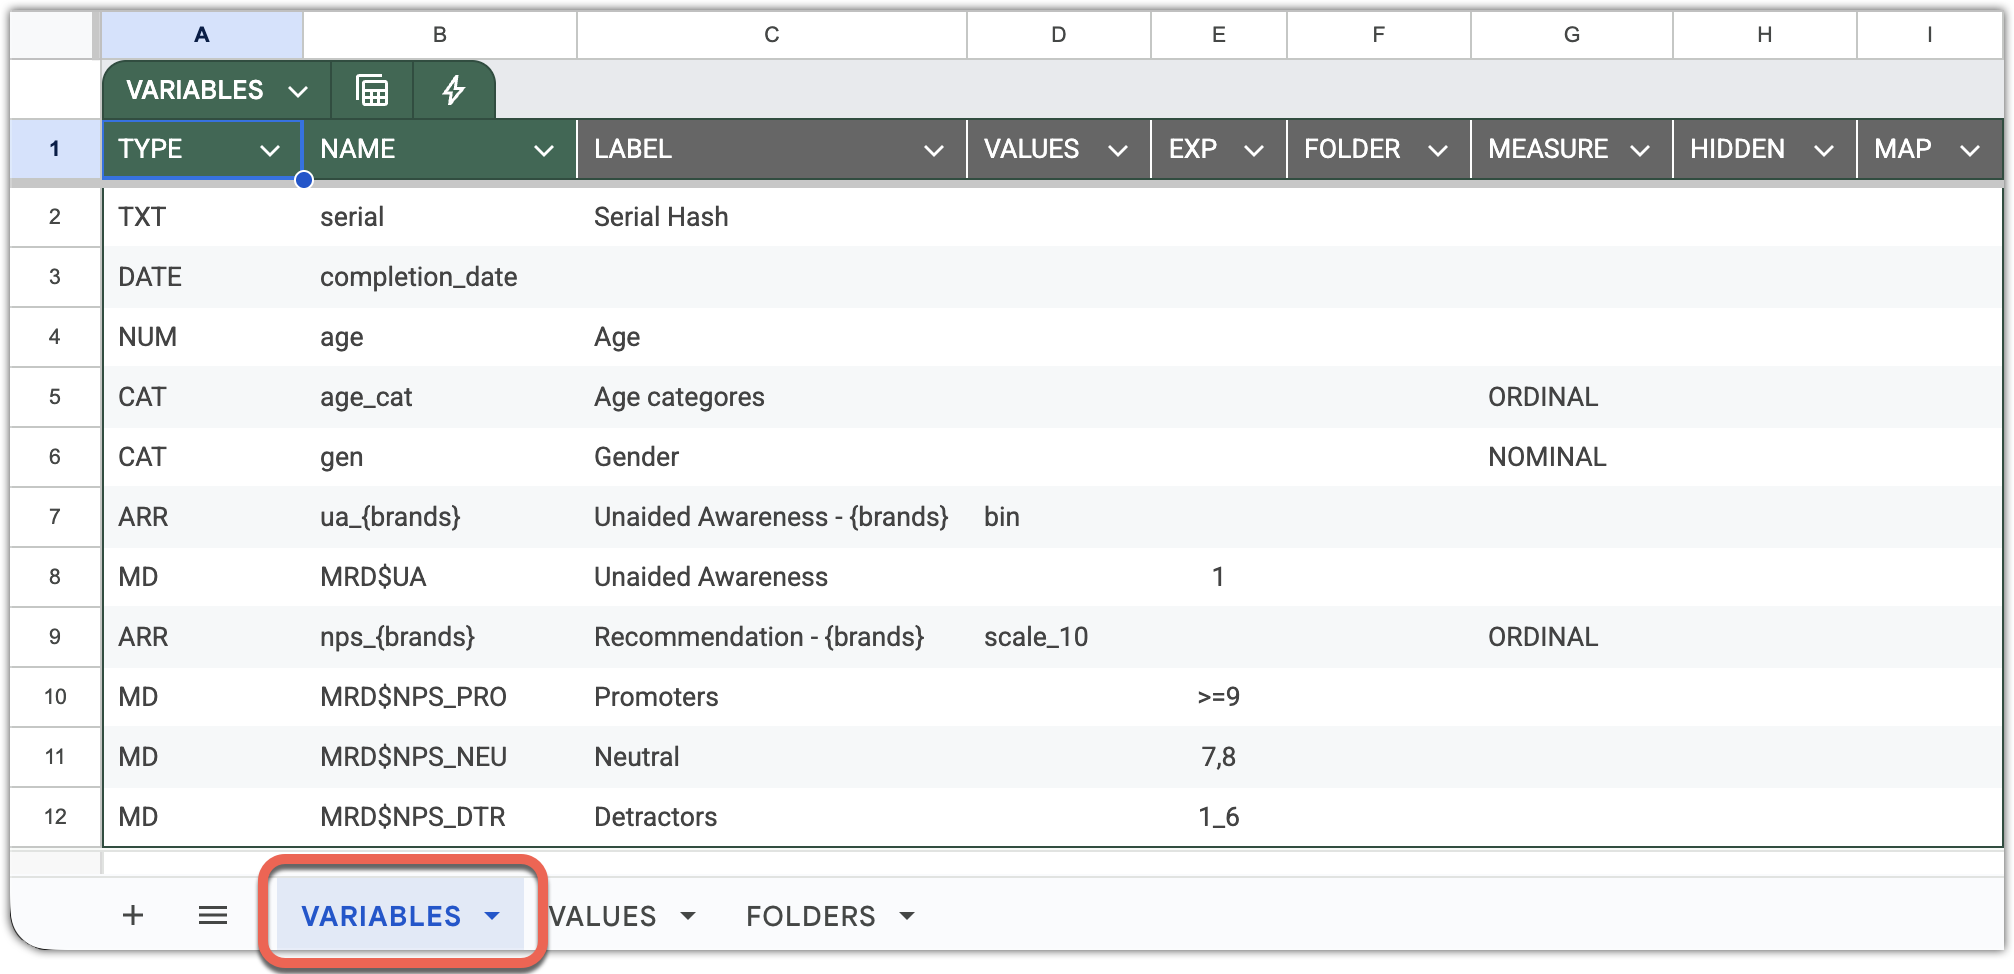
VARIABLES Sheet
Variables are defined on the VARIABLES sheet of the codebook. This sheet contains two mandatory columns – TYPE and NAME.
Each row defines either a single variable, a multi-response declaration, or a pattern representing a group of related variables that capture responses to a matrix-style question.
For greater stability, DataTile treats sheet names, column headers, variable types, and variable names as case-insensitive. Character case is only significant for labels, where it is preserved exactly as entered.
TYPE mandatory – Specifies the type of the variable. It can take one of the following values:
-
Variables:
CAT,DATE,NUM,TXT -
Multi-response sets:
MC(categorical),MD(dichotomous) -
Pattern:
ARR(array) - defines a set of cognate variables matching the pattern. -
Ignored variable:
IGNsignals DataTile to ignore the specified variable in the dataset.
Read more about Variable types in DataTile
NAME mandatory – Specifies the variable name as it appears in the SPSS file or as a column header in the Excel data file described by the codebook. Follow DataTile’s naming best practices to ensure consistency and compatibility across systems and scripts.
LABEL optional – Provides the variable’s label, usually the text of the survey question. On multilingual servers, you can include labels in up to three languages by adding separate columns identified with the two-letter ISO 639 language codes.
For example: label_en, label_ja, label_zh — for English, Japanese, and Chinese labels, respectively.
VALUES optional – If left blank, DataTile automatically searches for a value-label dictionary with the same name as the variable in the VALUES sheet.
You can override this by specifying a dictionary name in this column. This approach enables efficient reuse of shared dictionaries such as scoring scales, Likert scales, or brand lists across multiple variables.
NAME defines a value dictionary, but can be overridden by VALUE
EXP optional – Expression represents a Logical Condition on Numeric Values.
The interpretation of the expression depends on the variable type.
For dichotomous multi-response (MD) variables, it defines the “counted value”, which, unlike in SPSS, can be expressed as a logical condition rather than a single fixed value.
FOLDER optional – Specifies the folder in which the variable is located. The folder name must reference a folder defined in the FOLDERS sheet.
MEASURE optional – Defines the subtype of the variable.
-
For categorical variables:
NOMINAL(default) orORDINAL -
For numeric variables:
PLAIN(default),WT(weight), orPROB(probability)
If no measure is specified, DataTile automatically applies the appropriate default.
When you change a variable’s type during a codebook reload, remember to update the MEASURE column accordingly:
-
Categorical → Numeric: leave
Measureblank.
Don’t setNOMINALorORDINALfor numerics; it causes the dataset loading error. -
Numeric → Categorical: set
MeasuretoNOMINALorORDINALas needed (if empty,NOMINALis applied by default).
HIDDEN optional – A Boolean or binary flag (true/false or 1/0) indicating that the variable should be hidden in the DataTile database and excluded from user-facing views or analyses.
MAP optional – Allows you to map variables from the source data file to differently named variables in DataTile. Translation maps are useful when merging datasets with inconsistent naming conventions, enabling integration into a single benchmark or tracking database without modifying the original files.
Example:
If NAME = GEN and MAP = SEX, the variable SEX in the data file will be renamed to GEN in DataTile.
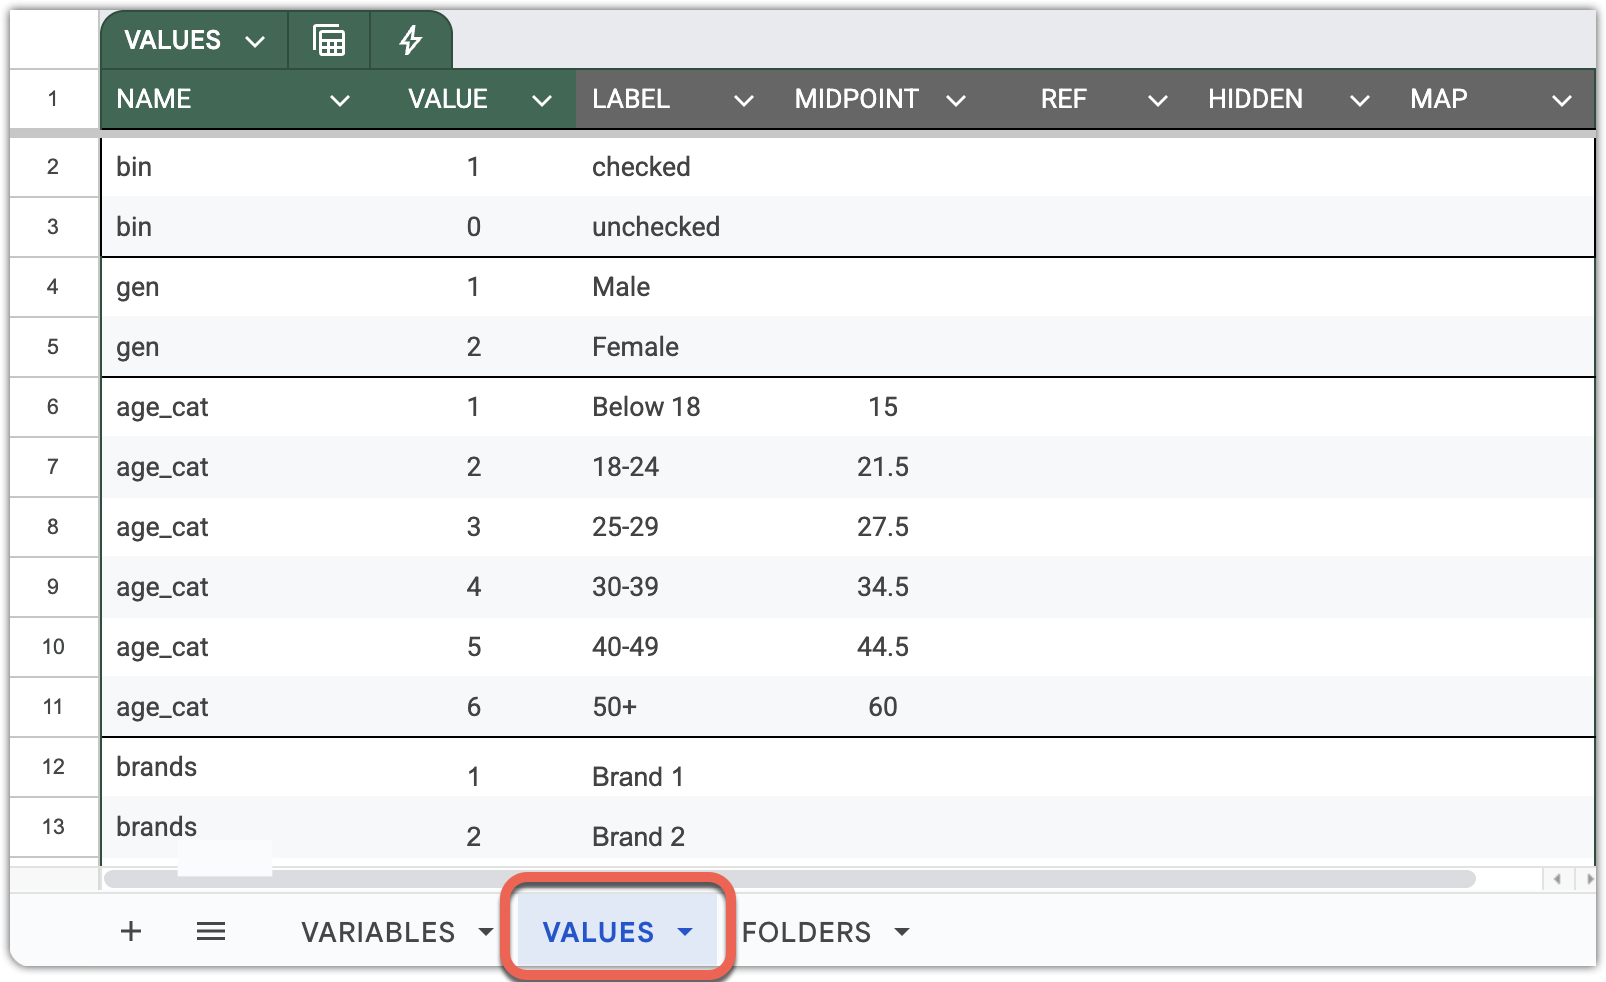
VALUES Sheet
Value labels are grouped by NAME, which identifies the dictionary they belong to.
The order of rows within each dictionary defines the display order of categories in DataTile.
NAME mandatory – The identifier of the value-label dictionary. Avoid using spaces in dictionary names. For best compatibility across systems and locales, follow the stricter naming convention described here.
VALUE mandatory – Most commonly, it’s a single number (integer in most cases) representing the category code. It can also be used to address alphanumeric values in Excel or CSV files.
LABEL optional – The category label. If no label is provided, DataTile uses the category’s VALUE as its label. On multilingual servers, you can include labels in up to three languages by adding columns identified with two-letter ISO 639 language codes — for example, label_en, label_ja, label_zh for English, Japanese, and Chinese, respectively.
MIDPOINT optional – The numeric equivalent of a category, used in volume or mean calculations. For example, when calculating the average age from an age_cat variable, DataTile automatically uses the specified midpoints corresponding to each age band.
REF optional – Reference to the variable names that make up a multi-response set, linking the dictionary entries to the corresponding variables in the dataset. Read more about it in the section “TYPE: MD”.
HIDDEN optional – A Boolean or binary flag (true/false or 1/0) indicating that the category should be hidden in the DataTile database and excluded from standard user views or analyses.
MAP optional – Allows you to translate or recode values from the source data file into different values or categories within DataTile on the fly during the loading process. Each entry in this column represents a logical condition on numeric values. When a source value satisfies the condition specified in MAP, it is mapped to the corresponding VALUE in the dictionary.
FOLDERS sheet
The FOLDERS sheet defines the folder hierarchy that appears in DataTile’s left-hand navigation. Variables reference these folders via the FOLDER column on the VARIABLES sheet. The sheet lets you standardise names, order, visibility, and localisation for every folder.
If the FOLDERS sheet is not present in the codebook, the existing folder hierarchy in the DataTile database will be preserved. However, if the database is created from scratch, all variables will appear in the root folder.
As elsewhere in the codebook, sheet names, column headers, and folder paths are case-insensitive. Labels are case-sensitive and are preserved exactly as entered.
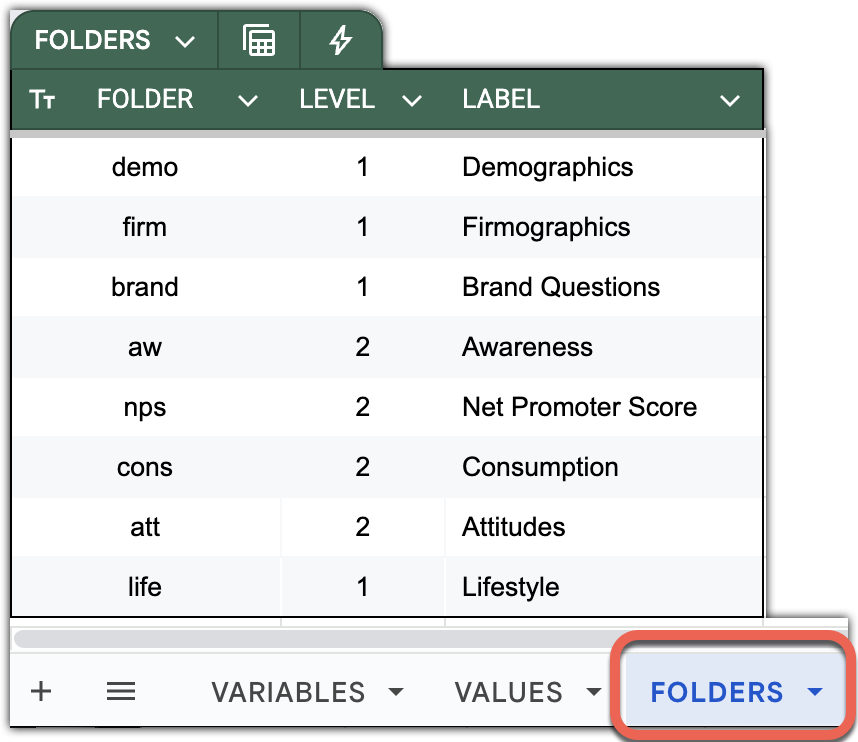
FOLDER mandatory – A stable identifier for the folder can be thematic (e.g., demo, firm, brand) or hierarchical (e.g., 1, 1.2, 3.2.1).
-
Must be unique within the sheet.
-
This is the value that variables reference from the
FOLDERcolumn on theVARIABLESsheet.
LEVEL mandatory – An integer indicating the depth in the tree where the folder is located.
-
The top level is
1. -
Higher than the previous row → becomes a child of the previous row.
-
Equal to the previous row → becomes a sibling under the same parent.
-
Lower than the previous row → “climb up” accordingly and attach at the new level.
-
Omission rule: if a LEVEL cell is left blank, it inherits the last stated LEVEL above (useful for consecutive siblings).
-
Max hierarchy depth is 5.
TYPE OPTIONAL – Display name shown in the UI. Labels are case-sensitive and preserved as entered.
Best practices for defining a folder hierarchy:
-
Choose durable identifiers: Use concise, stable
FOLDERIDs. -
Keep it shallow: Most surveys are easiest to navigate at 2–3 levels.
-
Keep it readable: For the best user experience, design folders to contain between a few and a few dozen variables, allowing users to browse them without excessive scrolling.
-
Batch siblings: For sequences of siblings at the same depth, set
LEVELon the first and omit on subsequent rows to reduce clutter. -
Rename safely: If you need to rename a folder in the UI, change its
LABEL; if you change theFOLDERidentifier, updateFOLDERreferences on theVARIABLESsheet accordingly.
This model keeps the sheet compact while making the hierarchy explicit, predictable, and easy to maintain - even for large, multi-market projects.
Variable Declaration and Syntax
Each variable in the VARIABLES sheet must have a declared TYPE that defines how DataTile interprets and processes it.
The simplest variable types – TXT, NUM, and DATE – do not use value-label dictionaries, and are used to store free text (open-ended answers, titles, and other verbatim), numeric measures (age, income, mileage, consumption, time spent), or dates (fieldwork date, event timeline, etc.).
Type TXT: Text Variables
Stores open-ended or string data exactly as they appear in the source file.
Declaration Example:
TYPE
|
NAME
|
LABEL
|
|---|---|---|
TXT
|
serial
|
Serial Hash
|
TXT
|
car
|
Respondent’s primary car brand
|
TXT
|
fb
|
Post-maintenance feedback
|
TXT variables are not aggregated in analyses but can be searched, filtered, displayed on the dashboard or included in reports.
DataTile provides specific verbatim processing tools:
-
Text Refiner – rectifies typos and codes titles into legit brand names or products.
-
Word Cloud –
-
Semantic Coder [Lab stage] – a comprehensive AI-powered coding solution.
Type NUM: Numeric Variables
NUM represents continuous or discrete numeric values such as age, counts, scores, or percentages.
Declaration Example:
TYPE
|
NAME
|
LABEL
|
MEASURE
|
|---|---|---|---|
NUM
|
wght_sc
|
Weight
|
WT
|
NUM
|
age
|
Respondent’s primary car brand
|
|
NUM
|
AIR_B1
|
Bloomberg - Average Issue Readership - personal probability
|
PROB
|
NUM
|
AIR_B2
|
CNN - Average Issue Readership - personal probability
|
PROB
|
You can categorise them for analysis. For example, recode into the “Age groups” categorical variable.
Calculate value statistics like Average, Share of Voice (SoV), Volume, etc.
Type DATE: Date Variables
DATE variables contain store timestamps, such as interview completion dates.
TYPE
|
NAME
|
LABEL
|
|---|---|---|
DATE
|
completed
|
Interview completion date
|
DATE
|
dob
|
Date of birth
|
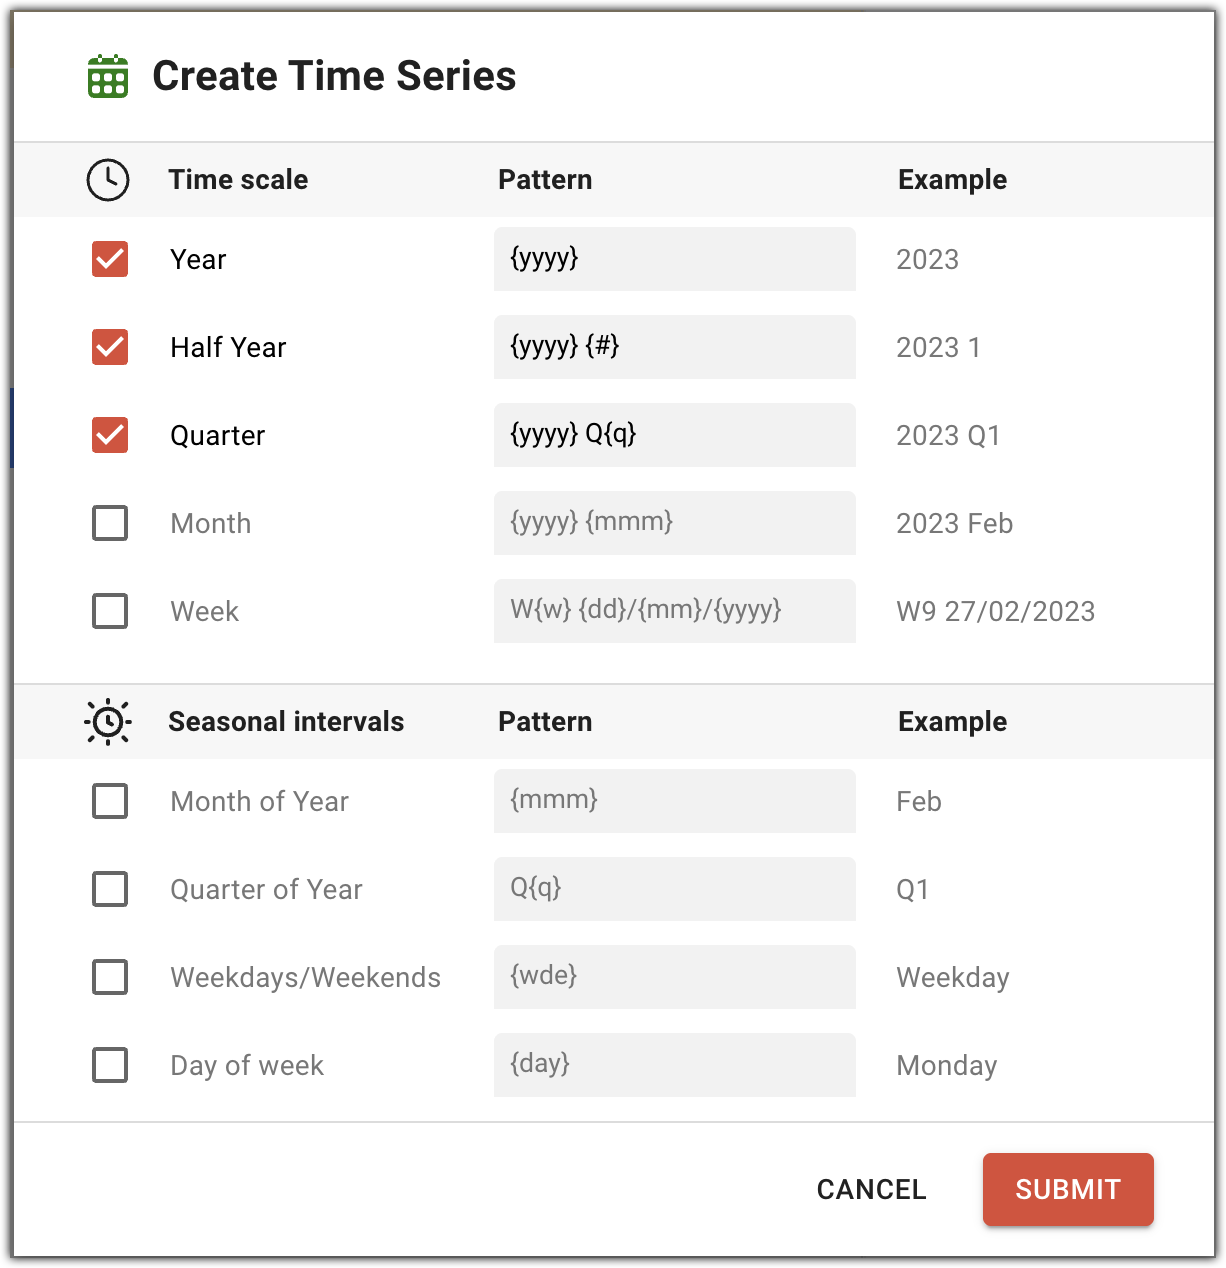
DataTile can help you automatically categorise DATE variables into waves or intervals.
-
DataTile supports SPSS and Excel date types. When loading a CSV data file, ensure that dates follow a recognised date format (e.g.,
YYYY-MM-DD). -
Can be used for time-based filtering, grouping, or duration calculations.
-
You can also categorise date variables by cutting them into custom intervals.
Type CAT: Categorical Variables
Categorical variables represent discrete response options, such as gender, region, or product choice. Each category (response option) corresponds to a numeric VALUE defined in the VALUES sheet and displayed through a user-friendly LABEL.
Thus, categories of each categorical variable should be defined in the VALUES sheet as a dictionary.
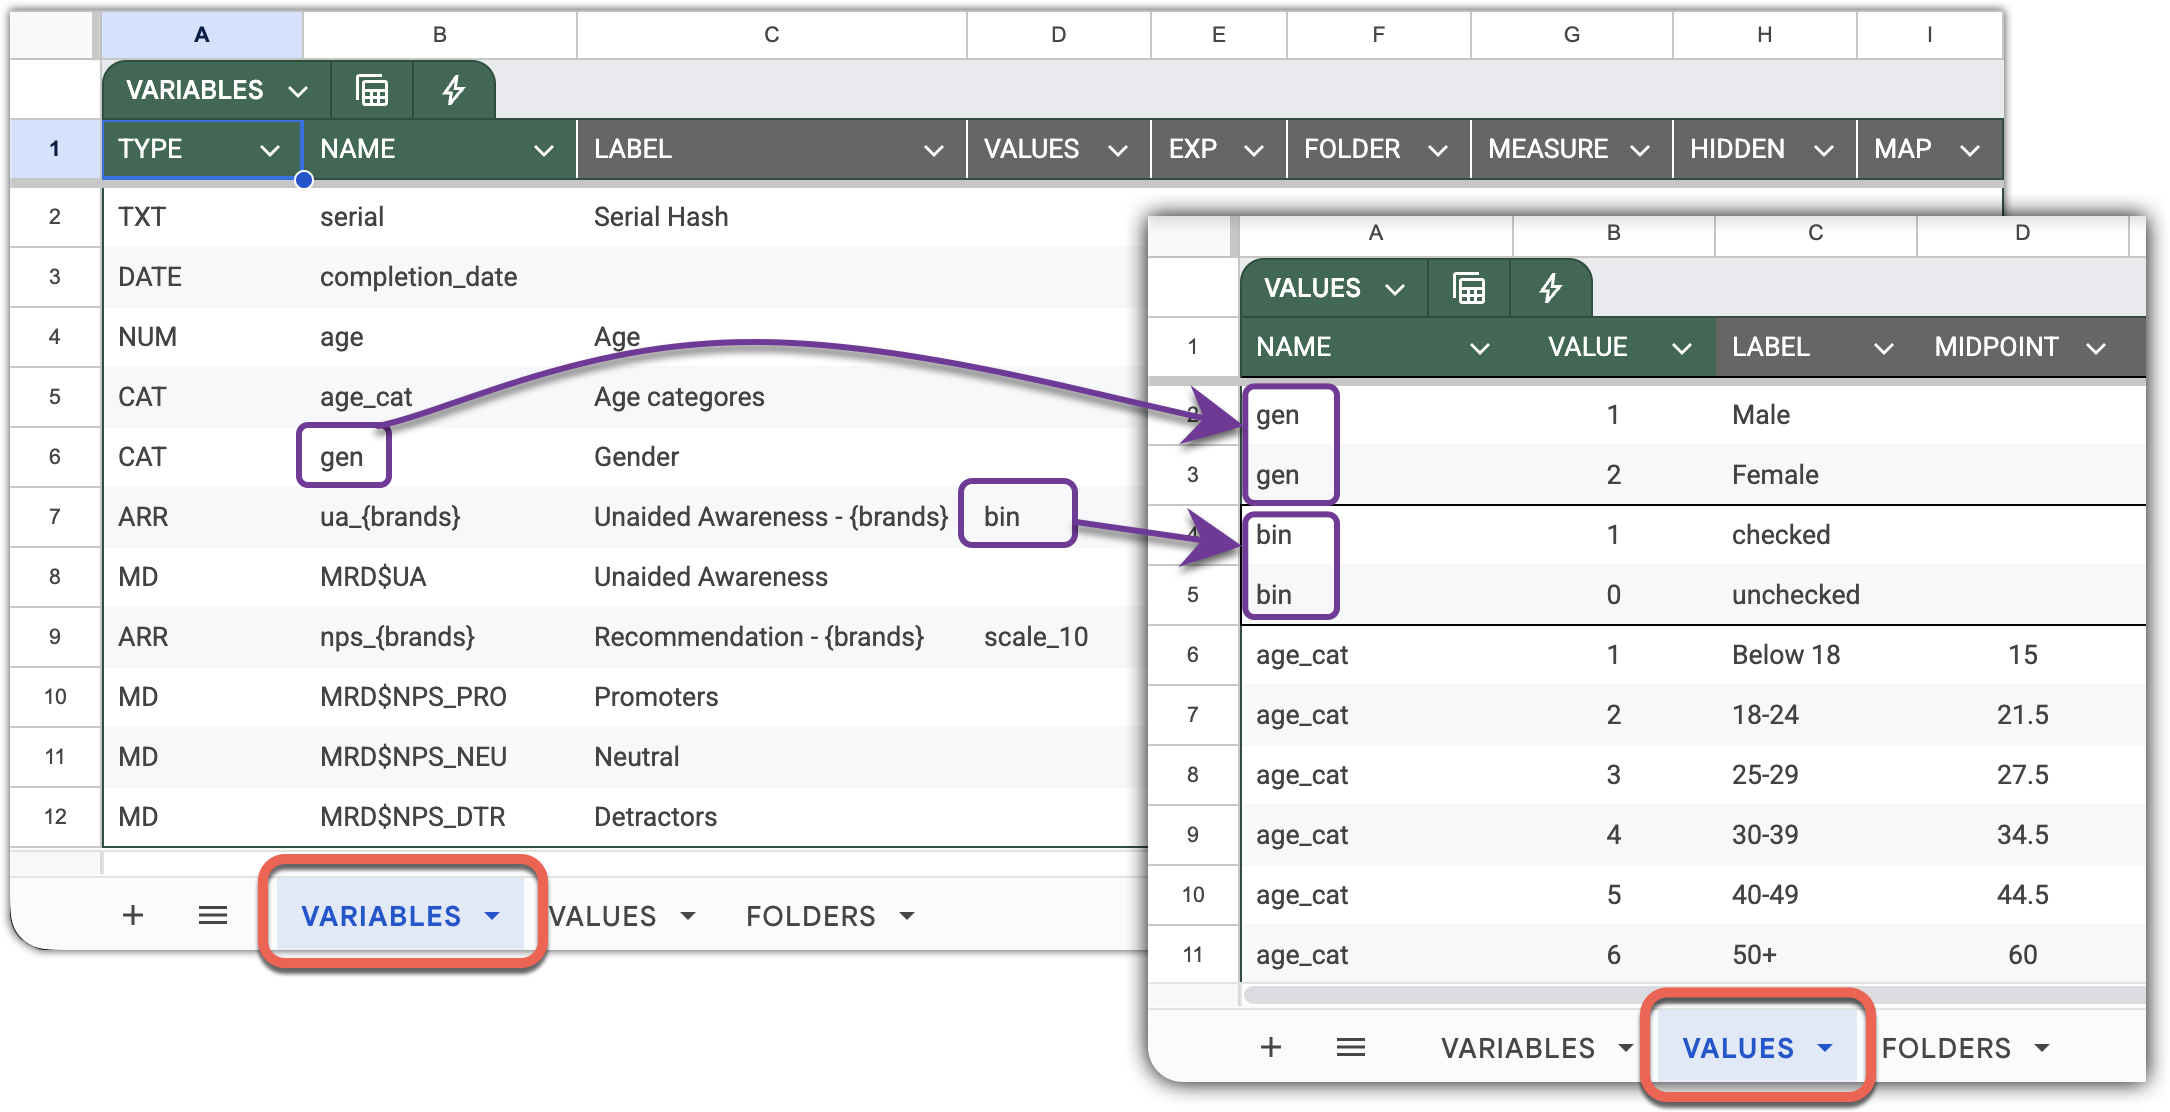
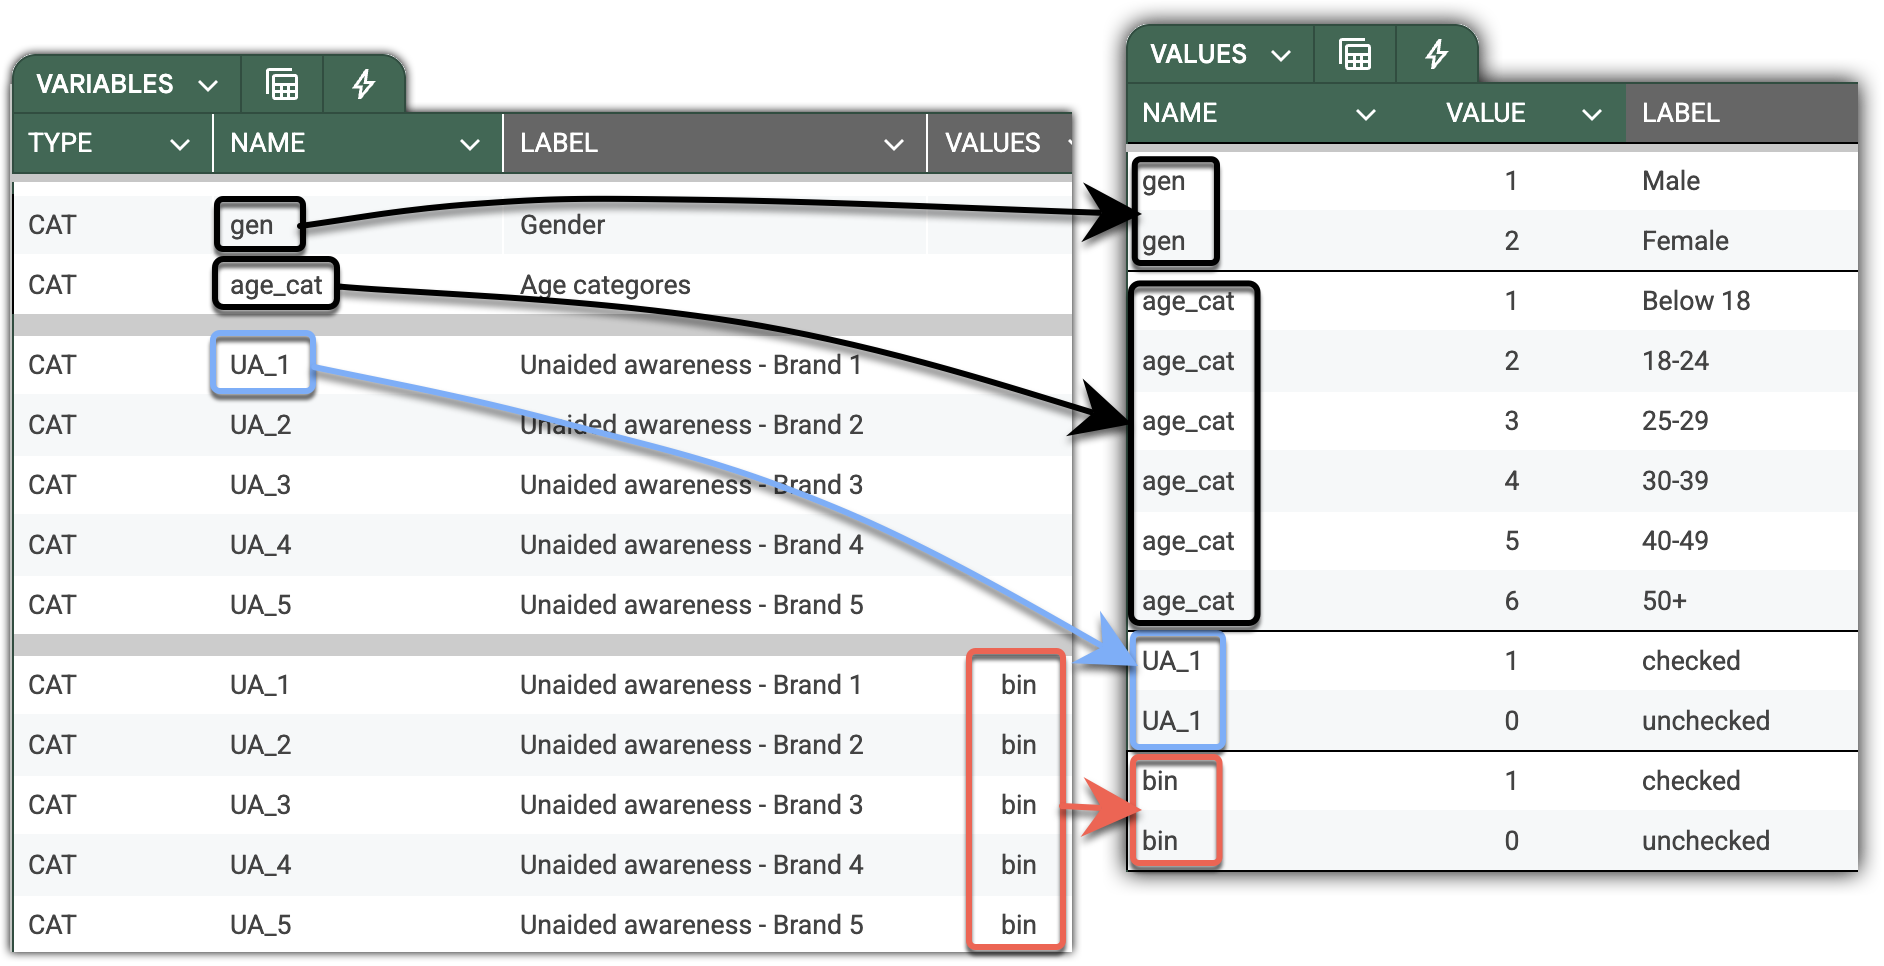
Spare effort by creating reusable dictionaries for cognate variables such as multi-responses, NPS, and Likert scales. You can override the variable dictionary by referencing a common one in the VALUES column.
In the screenshots below, you can see two equivalent declarations of the same set of “Unaided awareness” variables. Without providing a standard dictionary, you would need to declare repeated value labels for each of UA_* variables. However, by introducing the bin (for binary, but you are free to invent names you like) dictionary on the VALUES sheet, you can reference it from the variable declaration.
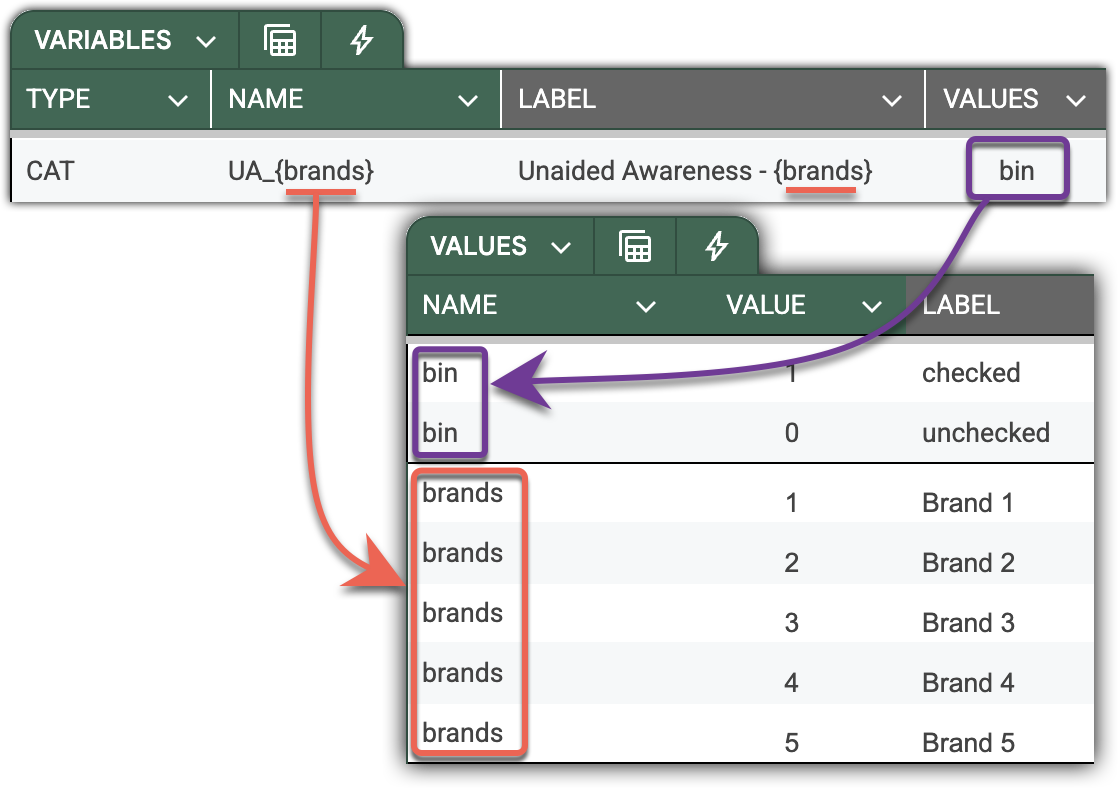
For sets of cognate variables with a clear naming pattern like “Unaided awareness” in our example, you can make the declaration even more succinct - with just a single line.
First, introduce the Brand dictionary on the VALUES sheet, and use it to define the naming pattern. The following illustration depicts a single-line declaration for the whole set of “Unaided awareness” questions. Note that the pattern applies synchronously across variable names and labels, virtually untangling them into five (in this case) variables.
Dictionaries are a powerful tool. They are a single point of control, allowing consistent declaration of variables across the entire survey, thereby eliminating the risk of human errors by design.
Key properties and usage:
TYPE – Must be CAT to indicate a categorical variable.
VALUES – Refers to a dictionary defined in the VALUES sheet. If left blank, DataTile automatically looks for a dictionary whose NAME matches the variable’s NAME.
LABEL – The variable’s display name in the DataTile interface and reports.
MEASURE – Specifies the subtype of the variable:
-
NOMINAL(default): unordered categories (e.g., Gender, Region). -
ORDINAL: ordered categories (e.g., Likert scales, Satisfaction levels).
MIDPOINT – Numeric equivalent assigned to each category in the VALUES sheet, used for calculating value-based statistics such as Average, Share of Voice (SoV), and Volume.
Best practices:
-
Use concise, interpretable, consistent variable names (e.g.,
AGE_CAT,BRAND,USAGE_FREQ). -
Maintain reusable dictionaries within and, when possible, across surveys (e.g., brand lists, Likert scales, attitudinal statements, etc.).
-
Maintain logical category order in the
VALUESsheet for ordinal variables. -
Assign
MIDPOINTvalues only to categories with a clear numeric progression. -
Use
MEASURE=ORDINALfor scales, levels, and scores where category order matters. -
Keep category lists concise — avoid unused or redundant codes.
Type MD: Dichotomous Multi-response Set
The MD (multi-response dichotomous) type is used to represent multi-choice questions where each possible answer is stored as a separate binary (0/1) variable in the dataset.
Each variable within the set indicates whether the option was selected (1) or not (0).
In this setup, 1 is called a “counted value”. But it’s not rare to create MD from variables with other values. For example, the NPS score.
You can define Promoters MD from NPS variables (values span from 1 to 10) by providing the logical condition defining the counted values in the EXP columns. This unique DataTile feature provides flexibility without the need to spawn recoded variables, as in SPSS.
Typical MD examples include:
-
Brands ever used
-
Media channels consumed
-
Product features considered
DataTile treats all variables belonging to the same set as one logical multi-response question, aggregating selections automatically for reporting and analysis.
Note the declarations of four MR sets in the screenshot below.
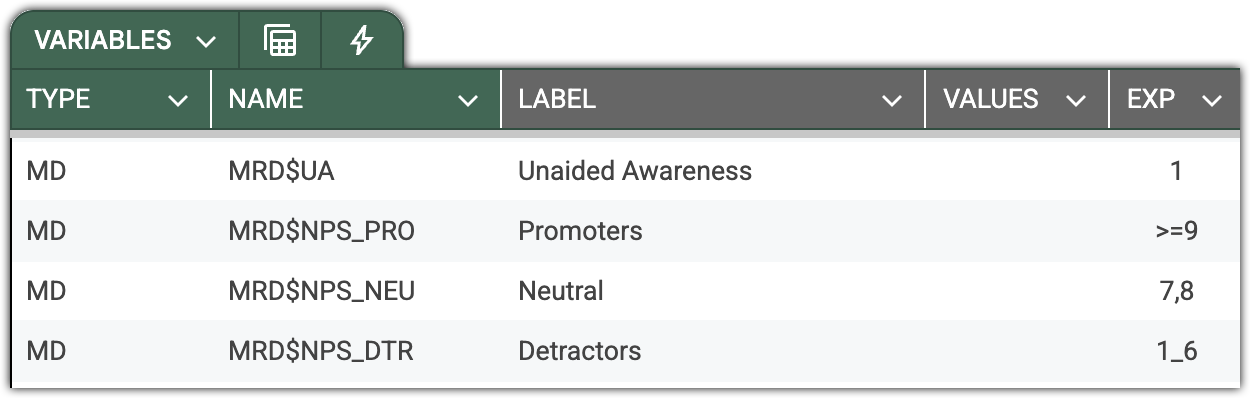
Key properties and usage:
TYPE MANDATORY – Must be set to MD to define a dichotomous multi-response variable.
VALUES MANDATORY – Refers to the list of variables constituting the MR set and maps them to the corresponding categories.
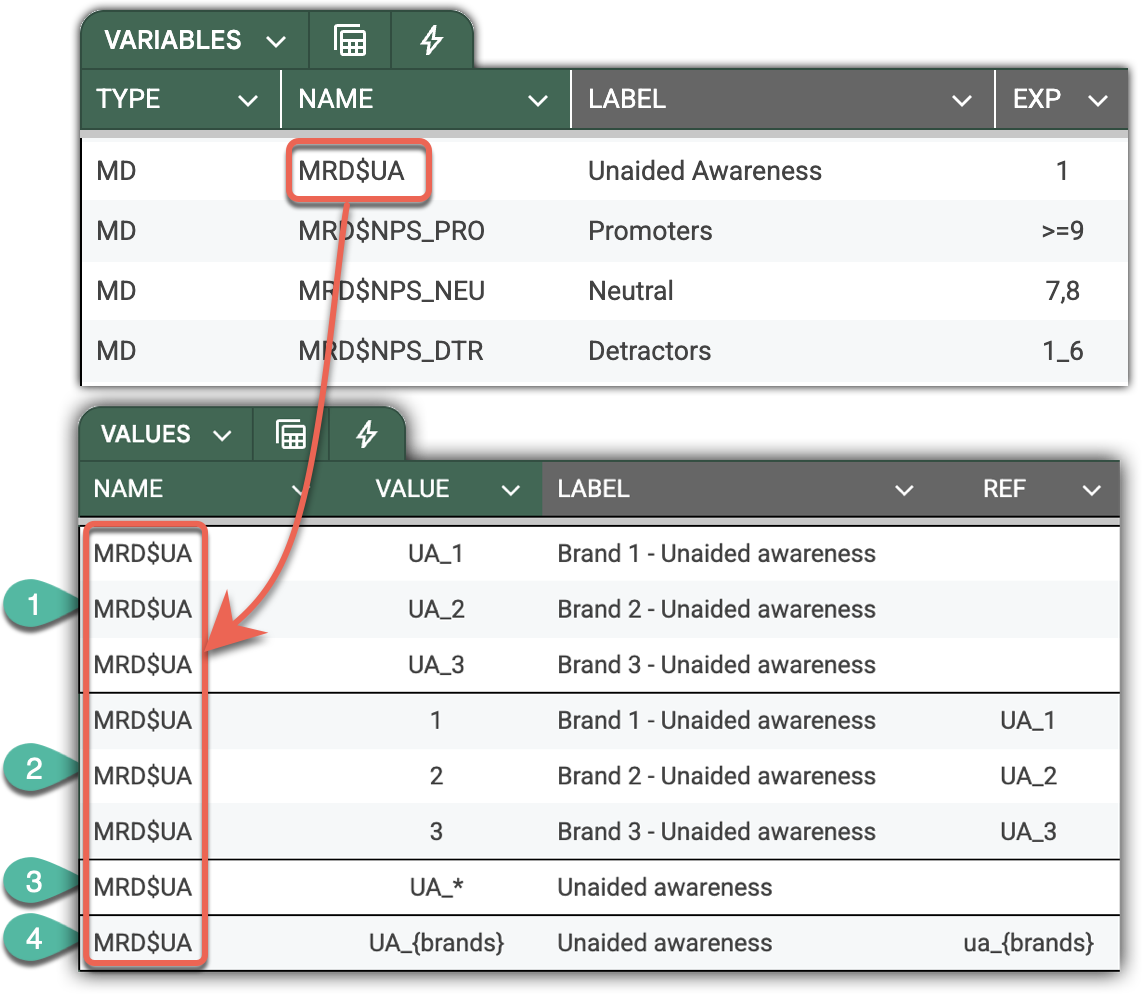
The following illustration depicts four different ways to declare and map MR set values to its variables.
-
Manual and straightforward declaration with explicit inclusion of variables. Though totally legit, this declaration does not assume future-proof dynamics – it will not automatically expand the MR set if a new brand (option) would appear in a subsequent wave.
If your MR set variables have a consistent naming pattern, like in the example below, DataTile will derive and assign corresponding values to the categories of the MR set. -
Same as above, provides a way to define values of the MR set categories explicitly. Enter category values into the
VALUEcolumn and map them to the variable provided in theREFcolumn. Use this approach when the pattern doesn’t unambiguously determine the MR set constituents, or when the due values don’t match the codes. -
This robust single-line declaration works when your variables follow a clear naming pattern. The asterics notation can be trickier –
Q18_b*,Q18_S*_UA, etc.
Important: the pattern should contain one and only one asterisk.
This declaration enables agility encompassing future changes in the brand list. I.e., DataTile will automatically add new variables matching the provided pattern. -
Same as 3, but allows high control by defining inclusion based on the dictionary.
EXP OPTIONAL – Defines the counted value — a logical condition that determines what qualifies as a “selected” response. Unlike SPSS, DataTile expressions can be full logical conditions, not just single values.
For example:
-
1– counts value 1 as selected -
>0– counts any positive number as selected -
1_6– counts values from 1 to 6 inclusively as selected
Best practices:
-
Use consistent naming conventions (e.g.,
UA_BRAND_1,UA_BRAND_2,UA_BRAND_3) to leverage pattern-based MR set recognition. Prioritise numeric brand coding over alphabetic (if data provided in Excel). -
Keep one shared dictionary (e.g.,
bin) for all MD variables in the same dataset. -
Use clear and concise labels – typically the brand and the common part of the question.
-
Define a counted value with the logical condition in EXP.
-
Avoid mixing response codes (e.g., using
1/99orY/N) – map them through the MAP column if needed.
Type MC: Categorical Multi-response Set
The MC (multi-response categorical) type is used for multi-choice questions where each response option is captured as a separate categorical variable, rather than as a binary (0/1) indicator.
Each variable in the set can hold one of several categorical values corresponding to the respondent’s choice.
In this structure, the number of variables in the multi-response set equals the maximum number of choices made by any respondent across the dataset. Each variable thus stores one selected category from the same categorical dictionary.
Typical use cases include:
-
Product or brand usage questions allowing multiple mentions
-
Main and secondary reasons for behaviour or attitudes
-
Multiple mentions of media channels or sources of information
Using Patterns for Bulk Declarations of Variables
A single-line pattern can declare a group of cognate variables, typically representing a multi-response, matrix question, or a block of standard questions.
1-tier Pattern
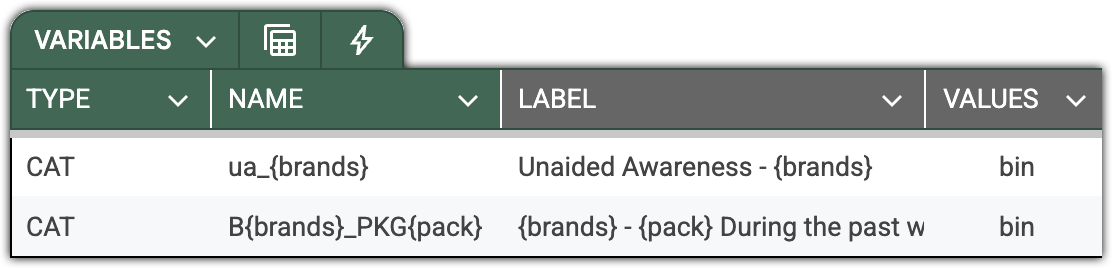
For example, the pattern below declares categorical variables for the brand dictionary. A single line replaces individual declarations for each brand in the list. This saves significant effort when your survey includes hundreds of brands.

When DataTile encounters a dictionary inside a pattern, it virtually iterates over the value labels from the dictionary. It uses value codes for the variable names and injects value labels, midpoints, and other parameters from the dictionary when unboxing the variable label template.
When DataTile encounters a dictionary inside a pattern, it iterates over the dictionary's value labels. It uses value codes as variable names and injects value labels, midpoints, and other parameters from the dictionary when unboxing the pattern.
-
NAME=UA_{brands}is unboxed asUA_1, UA_2, UA_3, UA_4, UA_5 -
LABEL={brands} - Unaided awareness…will be unboxed as the list of corresponding labels.
2-tier Pattern – Matrix Question
Here’s an example of a matrix question. We are asking respondents about the packaging of the soft drinks they consume.
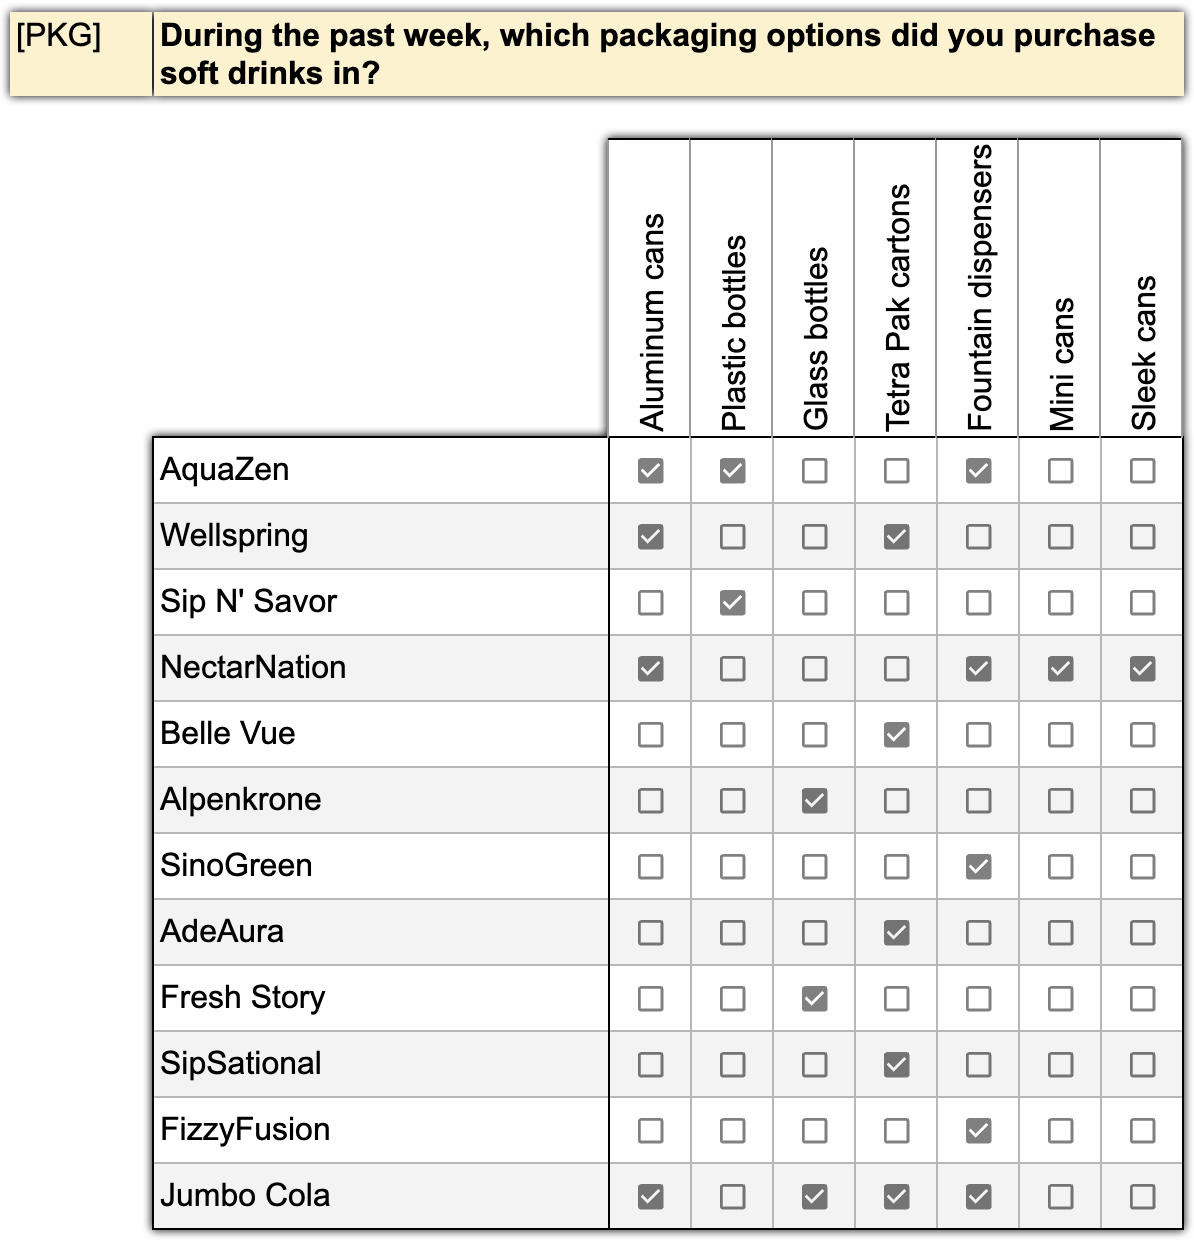
As before, all these variables can be declared with just a single line, assuming they follow a consistent naming pattern.
For example, having 100 brands and 7 package types, the pattern would define 700 variables in one line!
DataTile allows patterns up to 3 tiers – for example, when testing statements in relation to a set of typical products and a set of companies.
The efficiency of this declaration grows exponentially with the size of the dictionaries. As an example, for 100 brands, 10 products, and 20 attitude questions, you will effectively declare 100x10x20 = 20,000 variables with a single line!