
The core principle behind our dashboards is that controls drive dynamic widgets. Controls determine what data is shown and how it’s displayed. The assignment type defines the binding between controls and widgets.
Key aspects
-
Controls can function based on:
-
Data matching (e.g., “put on”, “filter”, “compare with”), when controls can query the database directly and match on underlying values.
-
Label matching (e.g., “mask”, “pin”, “highlight”), when controls can match solely on variable labels, independent of the database values.
-
-
Controls and charts can be based on different databases, allowing you to build dashboards that integrate and interact across multiple data sources. In that scenario, only assignment types based on label matching are available — database‐value matching assignments (like “put on”) are not supported.
How to assign a control to a widget
-
In EDIT mode, click on the control;
-
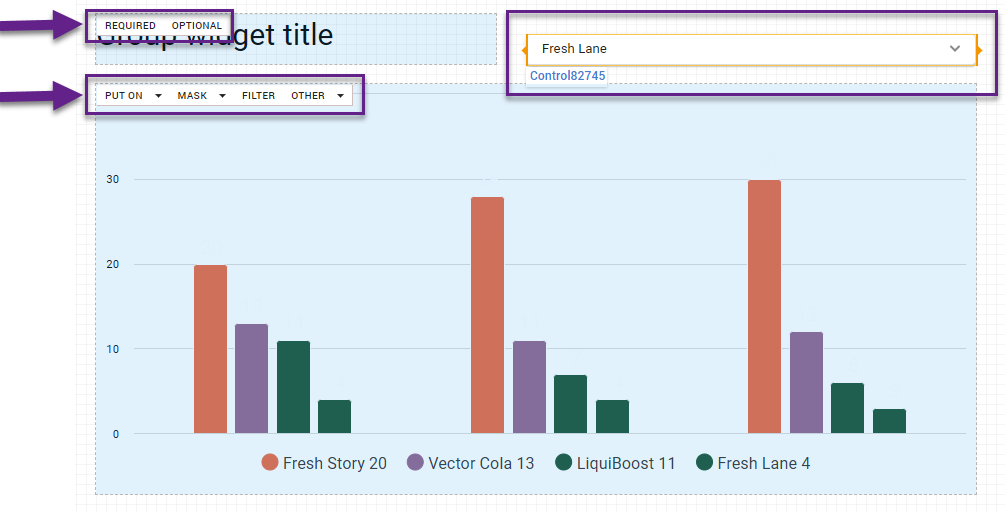
A command panel appears in the left corner of each widget. Depending on the widget type, here you can find a list of assigning options.
-
Choose the assigning option on the command panel of the selected widget.
Be aware that the interaction within a control-widget pair cannot be multivariate. -
Switch to the VIEW mode to check the controls in action.
Assignment types
There are several types of widgets on dashboards. In addition to the main chart widgets, there are images, text blocks, proxy controls, and other special widget types. We cover how controls are bound to these in the corresponding articles. Here, we will review assignment types related specifically to control–chart interactions.
-
Put on: Rows/Columns/Split - the control determines which variables are placed on the corresponding axes, just as they’re added in a cross-tab;
-
Mask: Rows/Columns/Split - will show only selected categories [label matching];
-
Filter - the control applies a category filter, functioning just as if you had placed those categories into the filter area of the crosstab;
-
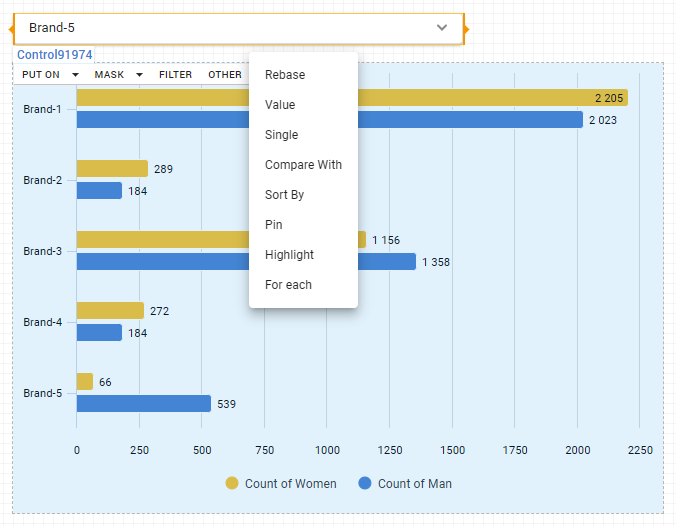
Other: Rebase - the control allows you to apply rebasing to the chart data;
-
Other: Value - has meaning while operating with numeric variables, a control option is equivalent to adding a value to the value drop zone on crosstab;
-
Other: Single - in this case, the selected options are assumed to be combined into a single indicator, using OR logic;
-
Other: Compare with - the options selected on a control will serve as the basis for comparison, just like the selections made in the standard comparison settings;
-
Other: Sort by - defines by which attribute the data will be sorted;
-
Other: Pin - this control allows you to pin the selected option to the top or left of a table or chart on the dashboard;
-
Other: Highlight - selected options will be distinguished by color, making them visually stand out in the chart or table;
-
Other: For each - this control multiplies charts for each selected option, generating a separate version of the chart for every selected variable.
How to check widget assignments in DataTile
-
In EDIT mode, select a widget you want to inspect.
-
In the left menu panel, navigate to the Assignments section.
-
You will see a list of all controls assigned to the selected widget, including the type of assignment (e.g., filter, put on, highlight, compare, etc.).
This allows you to check and manage how controls interact with your widget, helping ensure everything is linked as intended.