
The most basic function of the control is to determine which variables will be on the axes. In a crosstab, you can drag a variable from the category tree onto the axis, but on the dashboard, this is done using control-widget assignment ‘PUT ON’.
To do this, you first need to create a control with the corresponding options. Then, you can assign it to the chart as:
-
Put on: Rows - the variable will populate the X-axis;
-
Put on: Columns - the variable will populate the Y-axis;
-
Put on: Split - the variable will be added as a third dimension to the chart, altering the data visualization without replacing the axes.
How to
Multiple control assignments
Just like in the crosstab, you can place multiple variables on a single axis. You can use either one control (e.g. option groups) or several.
If multiple controls are used for populating the axis, there are a few important points to consider:
-
The order of axis population will depend on the position of the controls on the dashboard: those placed higher and/or to the left will be applied first.
-
All controls must contain variables from the same database. To avoid errors, if the chart and control are created from different datasets, the ‘Put On’ option will not appear in the assignment menu. Therefore, if you cannot see it, please double-check the database.
‘Put On’ for GRID Report
If your chart is based on a GRID Report, a Variables/Features assignment is available instead of Columns/Rows.
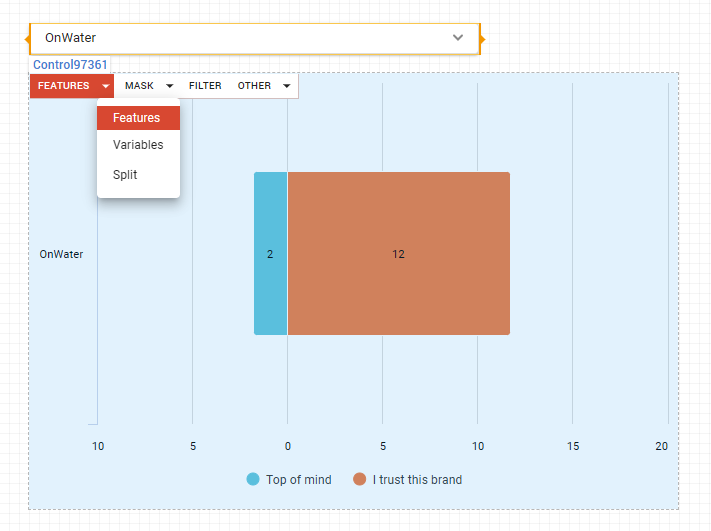
Remember, that for correct use of the control options for GRID reports, you should use the 'ALL' selection strategy when creating the control.