
A Grid Report is used to compare a family of related variables in one aligned table. In a standard crosstab, you normally place one variable on rows and another on columns, then analyse their intersections. In a Grid Report, you compare a set of related variables as one aligned structure:
-
Variables populate one axis of the report;
-
Features populate the other axis;
-
DataTile aligns matching categories across variables by label.
This mode is especially useful when:
-
several variables represent the same conceptual answer universe;
-
you want one compact table rather than several separate crosstabs;
-
categories overlap only partially across variables;
-
you need like-to-like comparison across brands, markets, waves, devices, measures, or repeated question blocks;
-
you need to build a Funnel chart.
A Grid Report works best when the variables are related, and their equivalent categories use consistent labels.
Key terms
Variables
In a Grid Report, variables are the repeated question elements being compared side by side. Depending on the survey design, these could be brands, devices, markets, statements, waves, or any other repeated entities.
Features
Features are the aligned categories that appear across those variables. Features can be:
-
native categories from the grid variables themselves; or
-
logical expressions built from those categories and from other variables in the database.
Label alignment
Grid Report aligns related categories by label. This means consistent naming is important. Make sure the variables have already been prepared carefully in the codebook. This includes:
-
keeping equivalent category labels consistent;
-
trimming redundant prefixes or suffixes where necessary.
Example: streaming services by device
Consider the matrix question:
On which of the following devices do you watch each of these streaming services? Please select all that apply for each service.
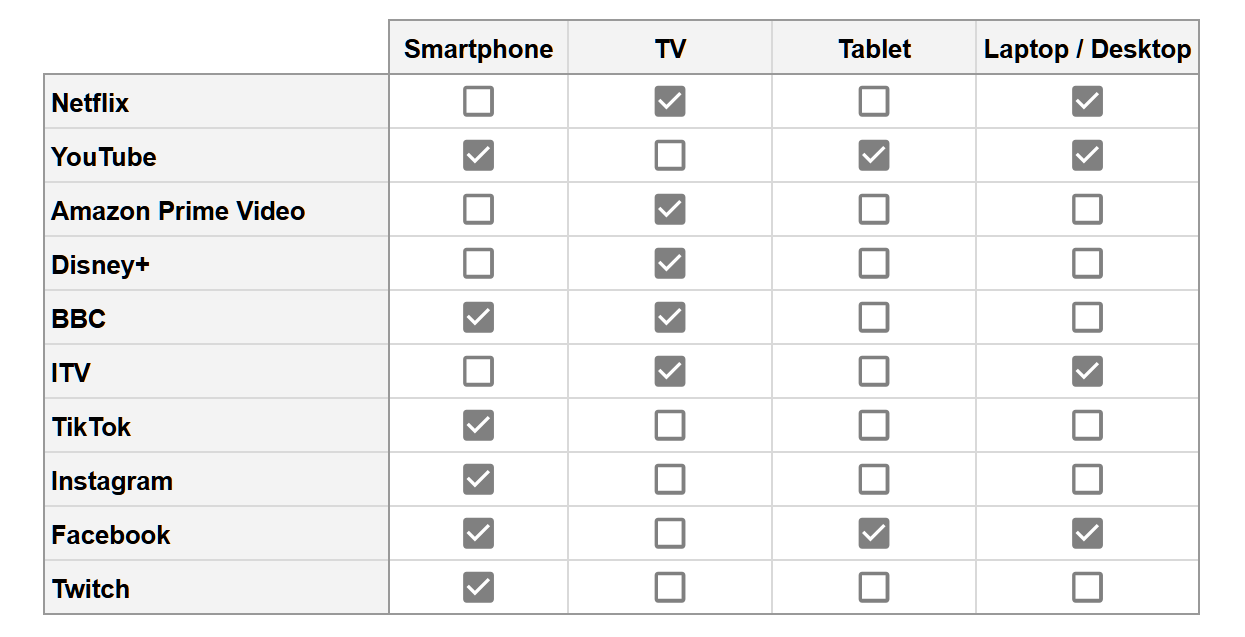
This is a good Grid Report example because it includes device-related variables from the same question family (TV, Smartphone, Tablet, Laptop/Desktop), along with service categories (features) that may only partially overlap across them. In other words, not all services are present for each device variable.
DataTile compares device variables in a single aligned table. This allows you to analyse service presence or combinations across devices in a single report, rather than building separate crosstabs for each device.
Building a Grid Report
Enable the Grid Report feature in the Database settings:
Settings → Feature Availability → Tick the ‘Grid Report’ checkbox.
-
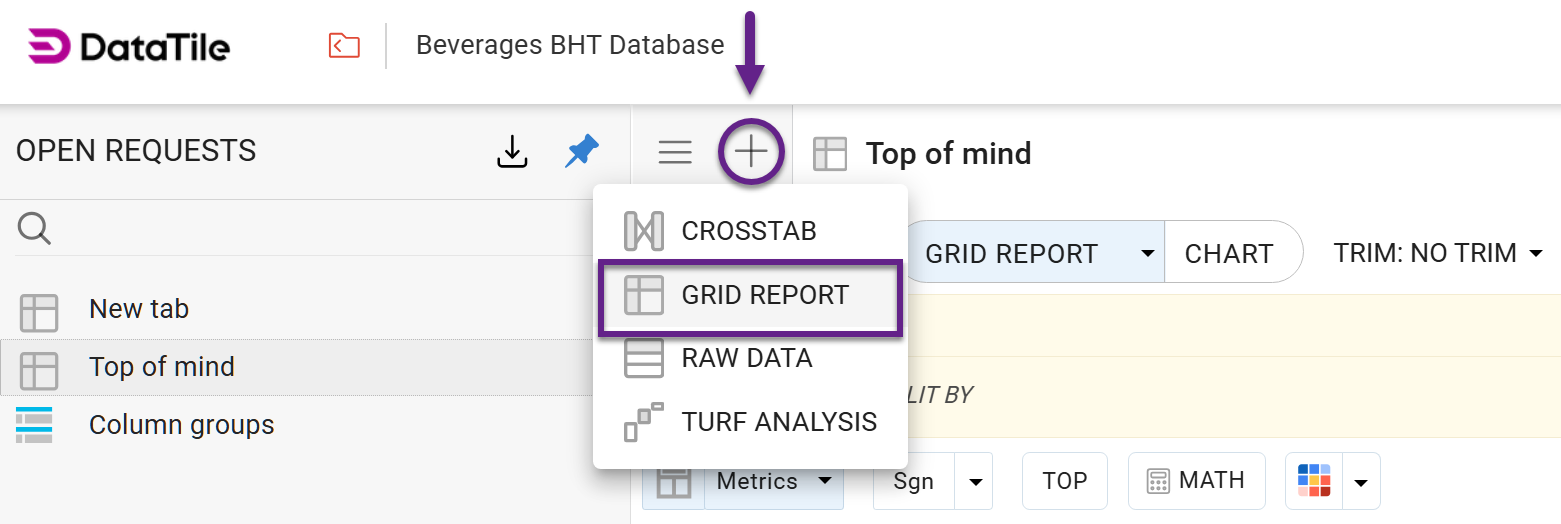
Switch the DVI to Grid Report mode. Click the ‘plus’ icon and select the ‘Grid Report’ option.
-
Add the related variables to the report as variables.
-
Let DataTile align the shared category labels as features.
-
Add metrics, filters, splits, or logical expressions as needed.
-
Calculate the report.
Logical expressions in Grid Report
Logical expressions can be used on both sides of a Grid Report:
-
on the variable side;
-
on the feature side.
These two uses behave differently and should be understood separately.
1. Logical expressions on the variable side
When a logical expression is added to a variable, it acts as a filter on that variable.
A logical expression on a variable changes who is included in that variable's calculation. Because of that, it affects the base.
In practice, this means that if a variable is analysed with an attached expression, such as ‘Female AND 18–34’, the corresponding Grid Report column no longer represents all respondents for that variable. Instead, it represents only respondents who satisfy that condition.
That affects all calculations for that variable, including:
-
counts;
-
percentages;
-
means;
-
significance testing;
-
any other metric derived from the filtered audience.
In our example, if we attach the expression Female AND 18–34 to the Smartphone variable, then the Smartphone column should be interpreted as: Smartphone viewing among Female respondents aged 18–34, not as smartphone viewing among the full sample.
Two Grid Report columns may look similar but still be based on different respondent groups if different logical expressions are attached to them. For that reason, variable-side expressions should be used deliberately since they redefine the audience included in the column.
Use logical expressions on the variable side when you intentionally want a variable to represent a subgroup rather than the full variable.
Before comparing variables with one another, check whether they use:
-
the same base; or
-
different filtered bases.
2. Logical expressions on the feature side
When a logical expression is added to a feature, it defines a row in the Grid Report. A feature-side expression does not redefine the whole variable. Instead, it defines what each row means and how DataTile should evaluate that row separately against each Grid Report variable.
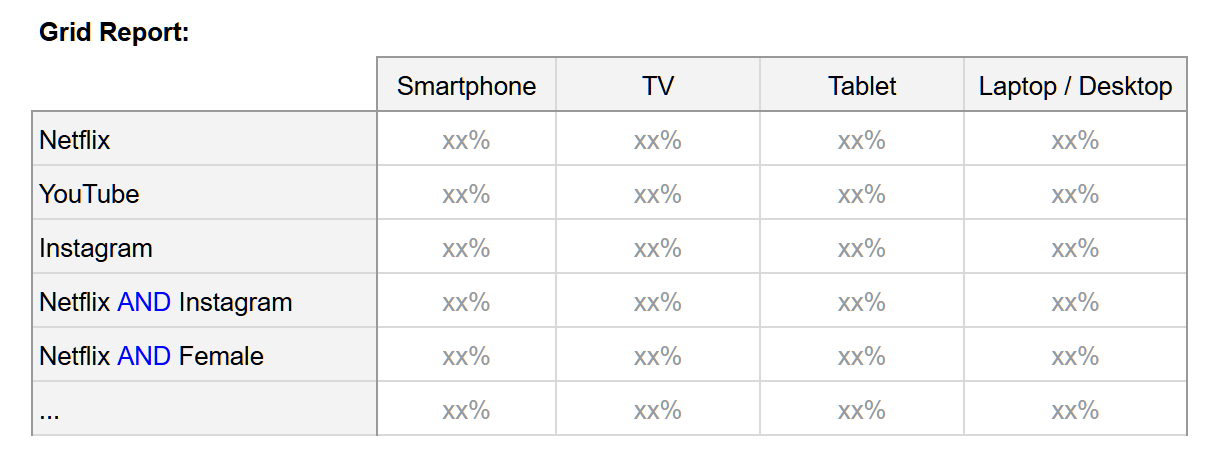
Typical examples of feature expressions
Examples of logical expressions on the feature side might include:
-
Netflix AND Female
-
BBC OR ITV
-
TikTok AND Instagram
In logical expressions, you can use any categories from a dataset, not only those that belong to the grid variables themselves.
This creates an important interpretation problem:
When DataTile sees a category label inside a feature expression, how does it decide where that label comes from? Is it
-
part of the current Grid Report variable,
-
or part of another variable in the same Grid Report,
-
or part of the wider database outside the Grid Report?
The answer is controlled by a database setting that is described below.
Database setting: Resolve expression labels within all grid variables first
This setting controls how DataTile resolves labels used in feature-side logical expressions.
In many Grid Reports, different variables contain different subsets of categories. In our streaming services example, one device variable may contain a service label while another device variable may not. Here, we will use the term ‘Grid family’ - the set of all categories presented in the grid, either fully or partially. Using this setting, you define how DataTile should treat such categories.
The path is Settings → Miscellaneous → The checkbox ‘Resolve expression labels within all grid variables’ at the bottom of this page.
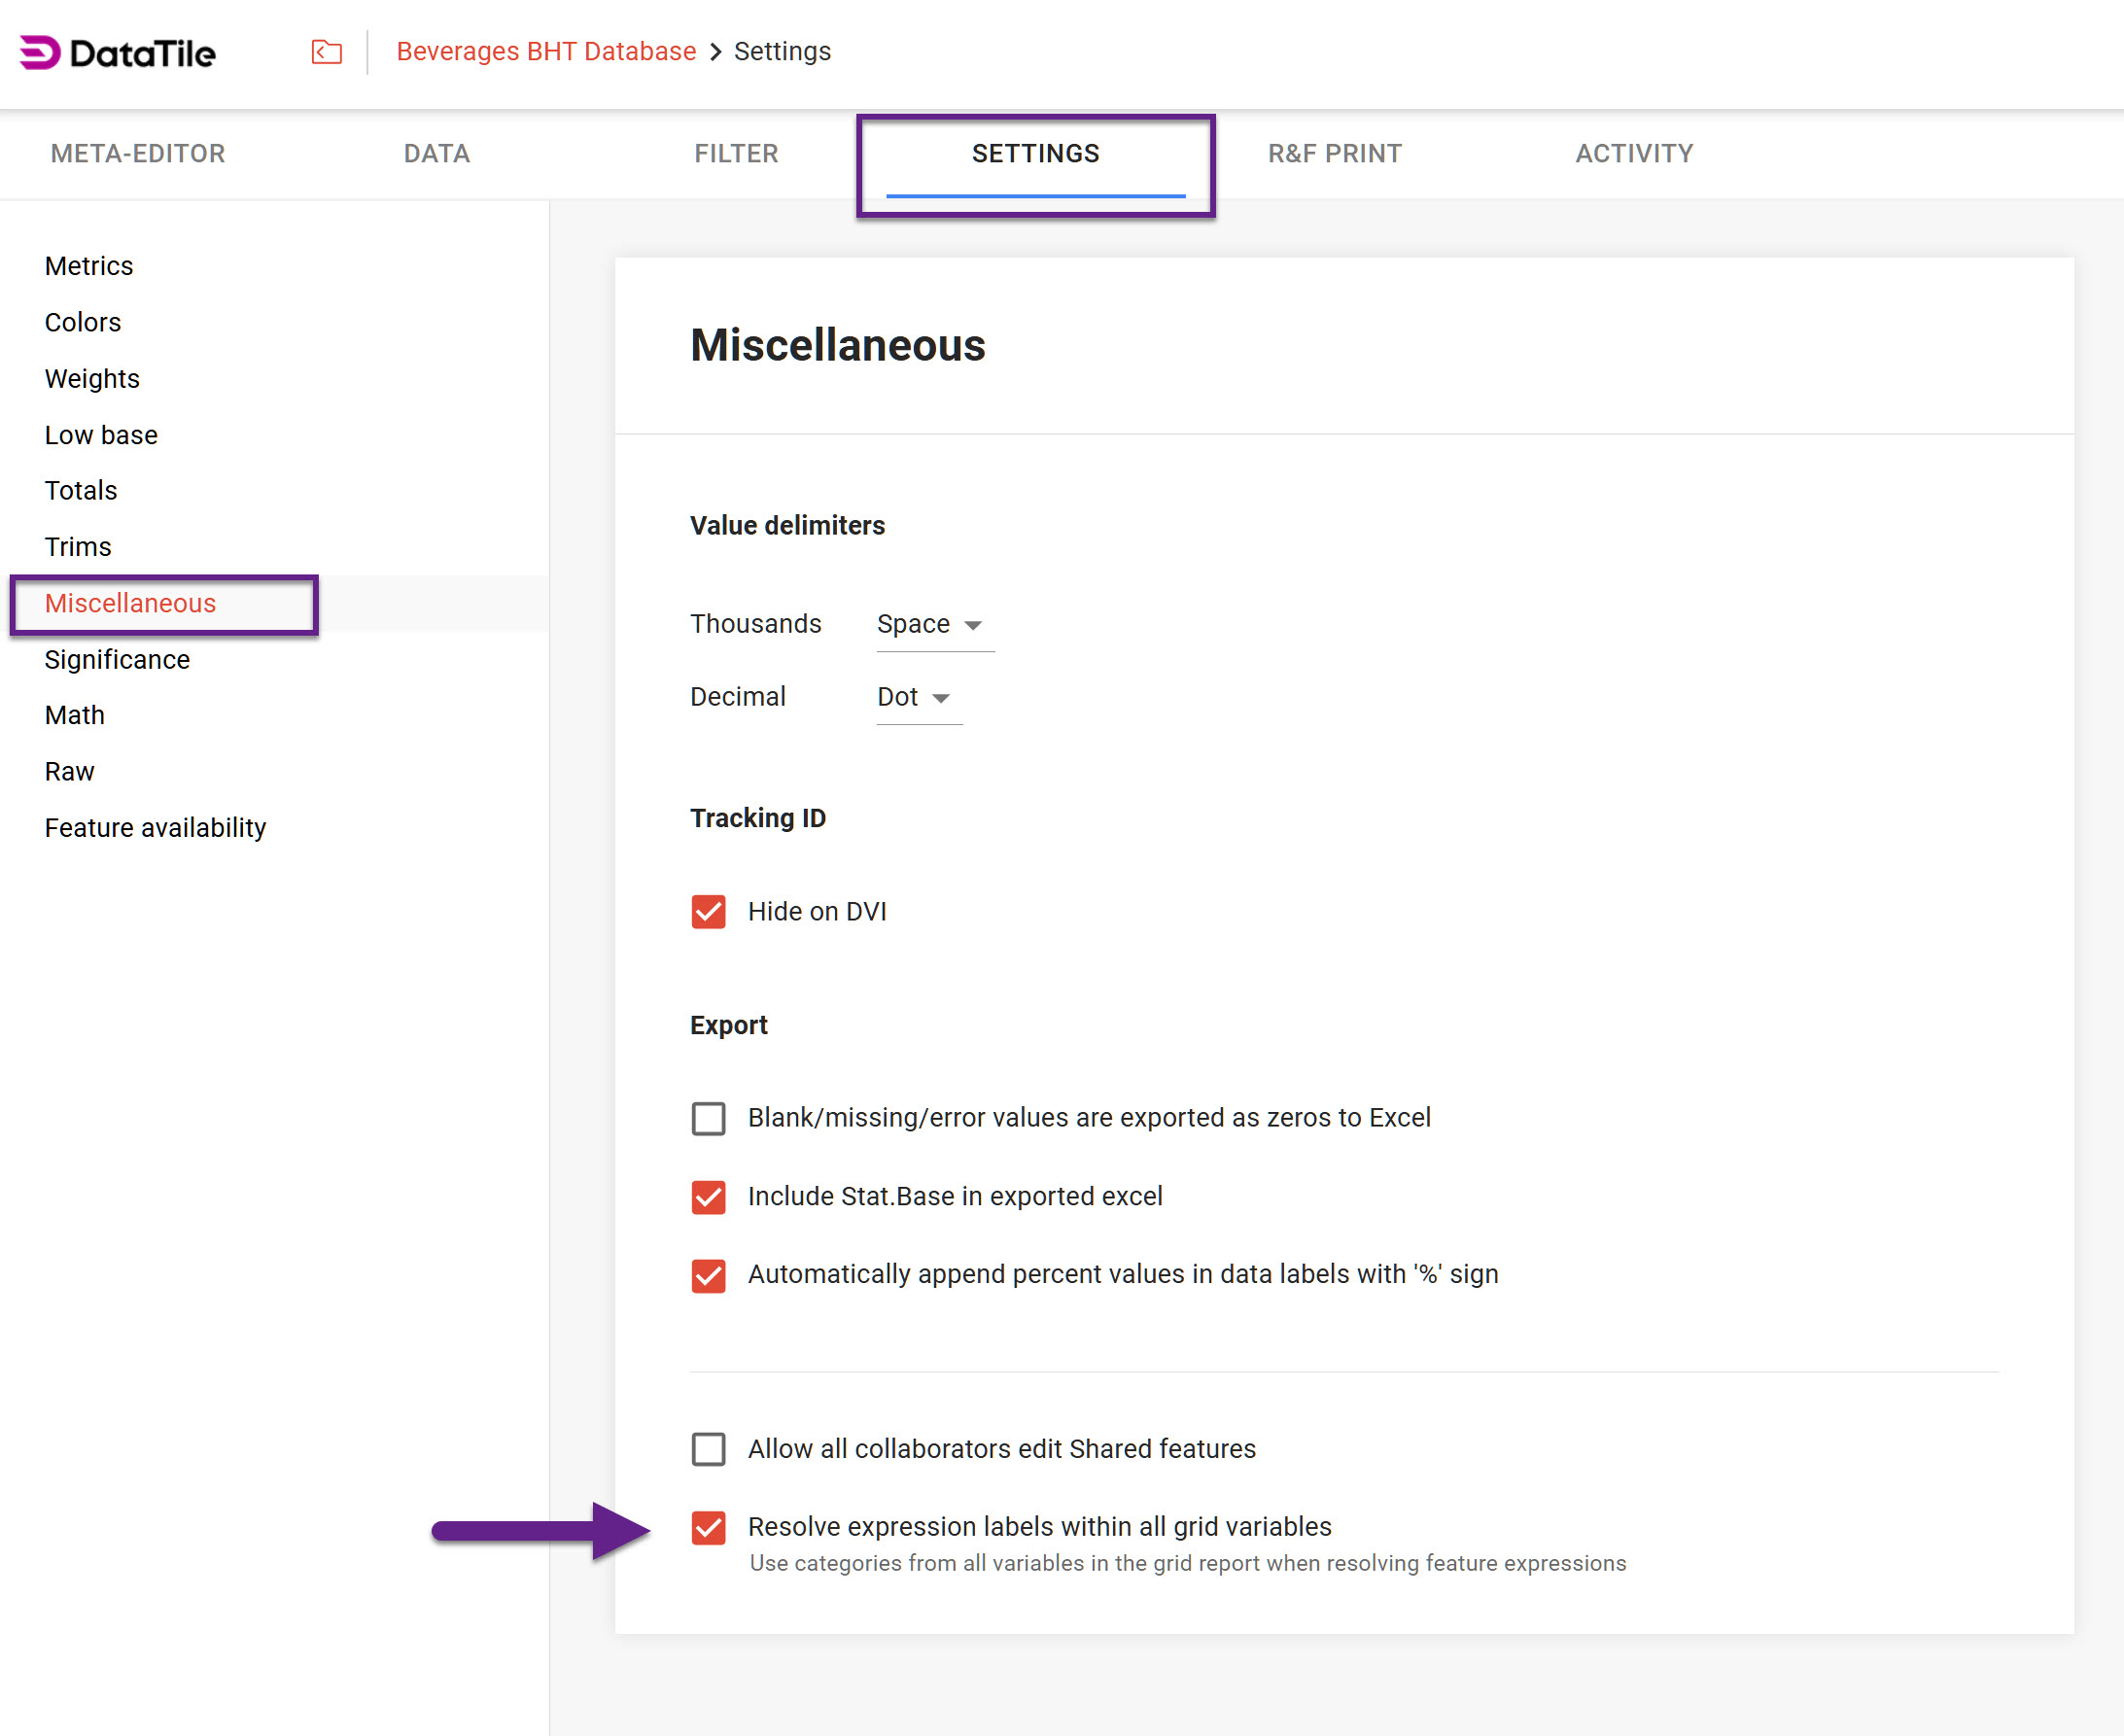
This checkbox is enabled by default in all databases.
When the setting is ON
Core rule
When the ‘Resolve expression labels within all grid variables’ is on, DataTile collects all category labels of all currently presented variables in a Grid Report and treats them as grid-native labels.
If the label belongs to the grid family but is absent in the current variable, DataTile keeps it inside the grid logic and treats it as absent there, and if it is a part of a logical expression, this expression evaluates to False. Only labels that don’t belong to the grid family are resolved to the original category used when the expression was created, outside the grid.
This setting prevents DataTile from incorrectly mixing categories from two different sources in the same feature expression. Without this rule, a label that should be interpreted as missing in the current variable can instead be pulled from the external category, changing the meaning of the row and producing results that do not match the user's intended logic.
When the setting is OFF
When the ‘Resolve expression labels within all grid variables’ is off, DataTile resolves each label in a feature expression as follows:
-
Check whether the label exists in the current variable.
-
If it does, resolve it there.
-
If not found, use the original category that was used when the expression was created.
This means that feature expressions are not treated as a shared grid-wide category family. Instead, missing labels can fall back to their source outside the grid.
Worked examples
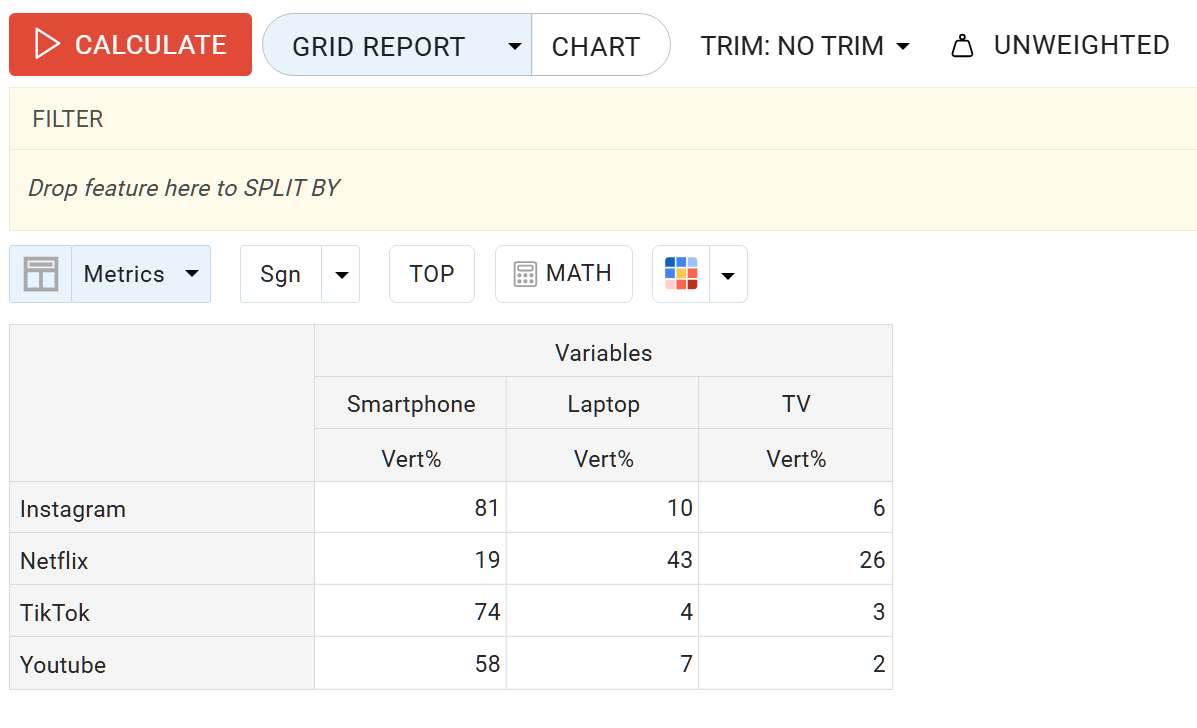
In our example:
-
Instagram is present in all column variables except TV;
-
Female is not present in any of the grid variables.
Example A: Netflix AND Instagram
With the setting ON
For the TV column:
-
Netflix is found in TV, so it is resolved within the TV variable;
-
Instagram is not found in TV, but it is found elsewhere in the Grid Report;
-
DataTile therefore recognises Instagram as a grid-native label;
-
because Instagram is missing in TV, it is treated as absent there, so that part of the expression evaluates to False.
So for the TV column, Netflix AND Instagram evaluates to 0%.
This is the intended behaviour, because the expression is interpreted entirely within the grid logic.
With the setting OFF
For the TV column:
-
Netflix is resolved from the TV variable, because it exists there;
-
Instagram is not found in TV;
-
because the setting is off, DataTile resolves Instagram to the original category that was used when the expression was created.
So the expression is no longer interpreted as Netflix and Instagram on TV. Instead, it becomes Netflix from TV combined with Instagram from its source category.
That is why the setting matters when a feature expression contains labels that belong to the grid family but are not present in every current variable.
Example B: Netflix AND Female
For the TV column:
-
Netflix is resolved within TV, because it belongs to the current variable;
-
Female is not part of any grid variable.
Therefore, in both cases — whether the setting is on or off — Female is resolved to its source category outside the grid variables.
This is correct because Female is not part of the Grid Report feature universe. It is an external category used in combination with a grid-native label.
Recommended usage
Use the setting ON when:
-
the Grid Report compares related variables with only partial category overlap;
-
feature expressions may reference categories that belong to the grid family;
-
you want missing grid-native labels to be treated as absent, not borrowed externally.
Be especially careful when:
-
row expressions combine grid categories with demographics or segments;
-
different variables contain different subsets of the same feature universe;
-
you are interpreting zeroes and need to know whether they mean absence in the current variable or true non-membership.