When working with a crosstab, you can apply mathematical functions to data in both rows and columns. Formulas use row or column labels as operands, however, there are some exceptions. In the tables below you can find detailed information on how functions are applied.
How to enable MATH for crosstabs
Go to Project settings → Settings → Math ->Tick the box provided to enable the display of the MATH window in the Crosstab. After enabling the feature, the ‘MATH’ button is displayed above the crosstab in the DVI interface.
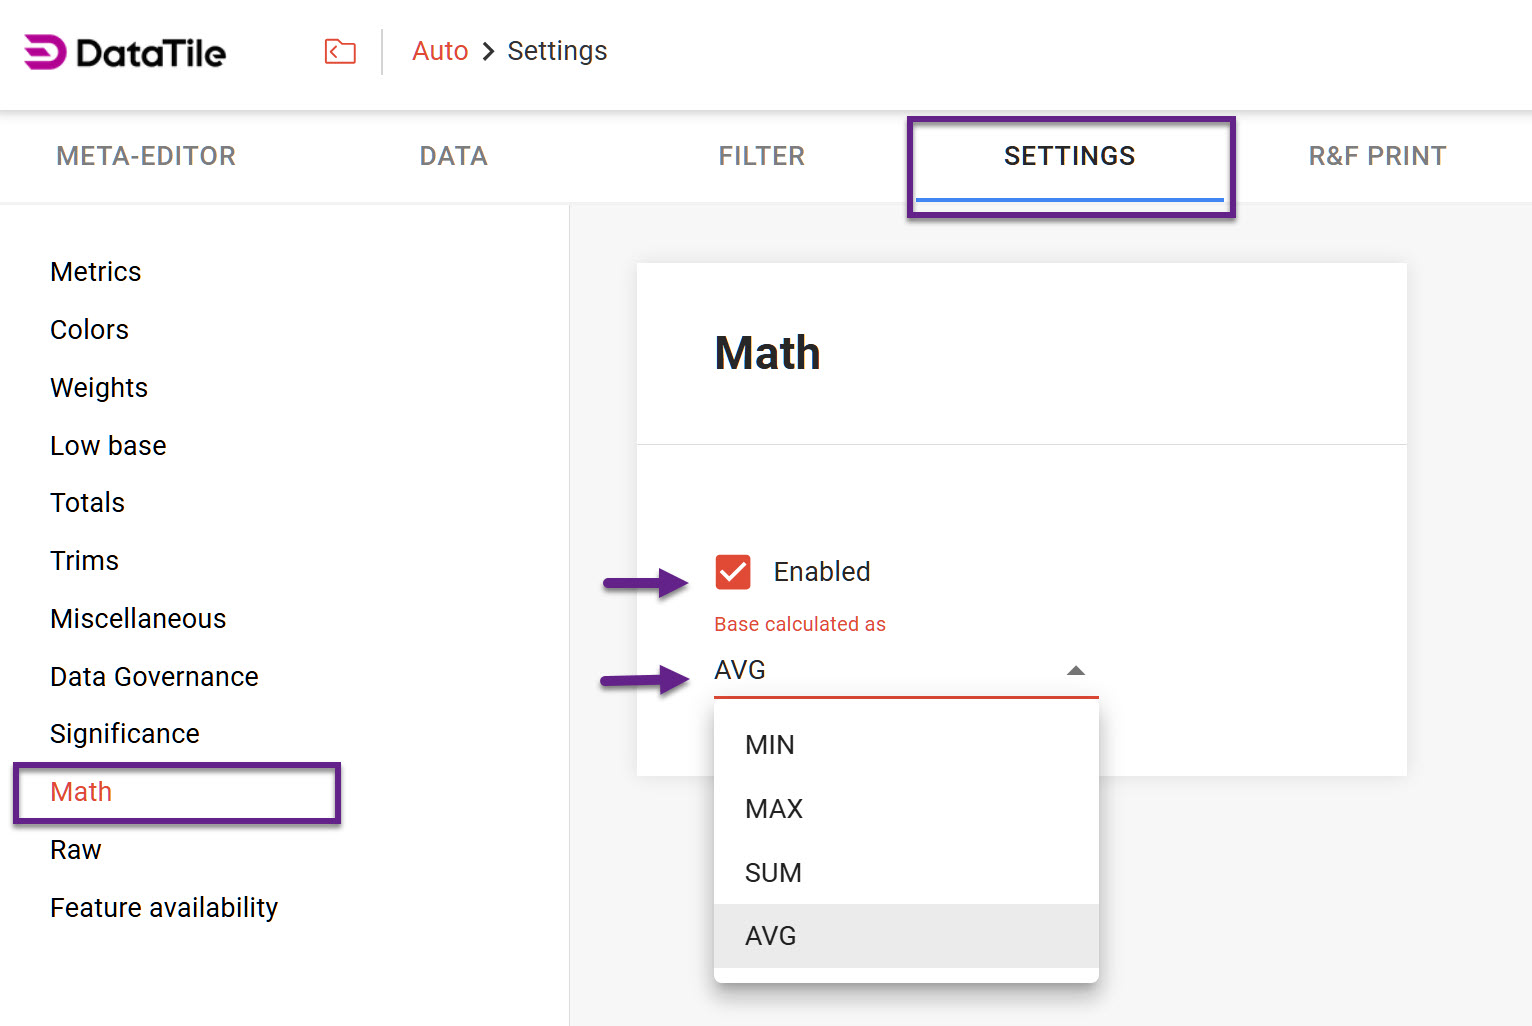
Note that when applying mathematical operations, you can use data with different base sizes. In such cases, the base calculation will follow one of four available methods, which can be selected in the project settings:
-
AVG - as an average of bases;
-
SUM - as a sum of bases;
-
MIN - as a minimum base;
-
MAX - as a maximum base.
How to use MATH in crosstabs
Use the MATH button above the crosstab to open the formula editor.

-
First, choose whether the calculation result should appear in a row or a column. Depending on this, you can use variables from rows or columns for your calculations.
-
Press Ctrl+Space / Cmd+Space to open the prompts.
-
Enter your expression in the MATH window using formulas and arithmetic operations.
-
Click Add to insert the result into the selected row or column.
Syntax & Formulas Usage
A range of functions represent metrics that previously had to be deliberately added to a crosstab. Now you can get the value of a metric by a function, then apply a mathematical operation to it.
These metric functions are:
|
Syntax |
Result |
|---|---|
|
|
returns the mean value based on the digit value of the selected variable |
|
|
BASE and UBASE (unweighted base) return the value of the selected variable depending on the dimension: applied to rows show the horizontal base; applied to columns show the vertical base. |
|
|
returns the Horizontal Base value of the selected variable; returns the Unweighted Horizontal Base value of the selected variable; returns the Vertical Base value of the selected variable; returns the Unweighted Vertical Base value of the selected variable; |
|
|
returns the statistical base value; returns the common unweighted base value |
|
|
returns the count of the selected variable |
|
|
returns the horizontal percent of the selected variable |
|
|
returns the value of the unfiltered Affinity index returns the value of the filtered Affinity index |
|
|
returns the vertical percent of the selected variable |
|
|
returns the volume value of the selected variable |
Other functions give you the following values:
|
Syntax |
Result |
|---|---|
|
|
returns the absolute value of the chosen variable or the expression |
|
|
returns the average value of the chosen variable or the expression |
|
|
returns the average value of the chosen variable or the expression including SYSMIS |
|
|
returns the average value of the chosen variable or the expression excluding SYSMIS |
|
|
return average value for the row/column, accounting for the missing values |
|
|
calculates the average after table-level operations have been applied (masking, filters, trimming, etc.), excluding SYSMIS |
|
|
calculates the average after table-level operations have been applied (masking, filters, trimming, etc.), including SYSMIS |
|
|
returns the average value from a weighted base |
|
|
returns the value of a particular cell by specifying ‘column, row’ OR ‘row, column’ respectively, using commas |
|
|
returns the correlation coefficient of two cell ranges. See the example below |
|
|
returns the number of rows or columns with variable values in the table; series with MATH or logical expressions are excluded from counting |
|
|
returns the number of rows or columns with variable values, accounting for the missing values |
|
|
returns cumulative totals for rows/columns |
|
|
takes a row/column as an input and produces a row/column with the linear approximation. It returns a line that fits the provided points. |
|
|
returns the largest value in a row/column when used with an argument, the function returns the largest value only within the specified range of rows or columns. |
|
|
returns the label of the largest value in a row/column |
|
|
returns the median value of all series |
|
|
returns the smallest value in a row/column when used with an argument, the function returns the minimum value only within the specified range of rows or columns. |
|
|
returns the share of a value within a row or column relative to the total of that row or column. It can be applied to a specific row or column using its label. You can also use the first and last operators, which apply the function to the first or last row/column, regardless of the data they contain. |
|
|
returns the percentage rank of a value in a row/column |
|
|
exponentiation
|
|
|
returns the rank of a value in a row/column. See the example below |
|
|
returns the perpendicular rank of the value: the rank within the row will be displayed in the column and vice versa. See the example below |
|
|
the REF function is designed to reference a row or column without specifying a label. Currently, you can use First or Last as operators for this function in DataTile. |
|
|
returns a value in a row/column rounded to an indicated decimal point |
|
|
returns the value of the sum of the given set of variables |
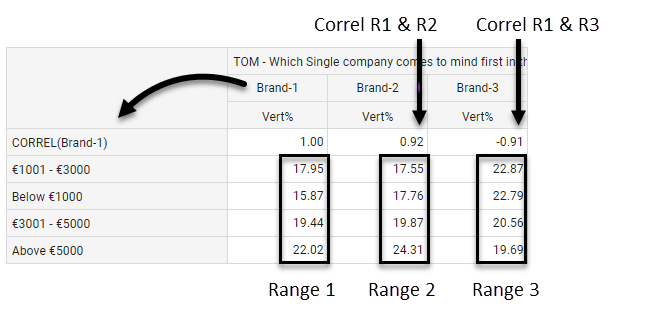
CORREL calculations
Unlike the CORREL metric, the mathematical formula for calculating the correlation coefficient is applied not to a single cell, but to two ranges of cells. Here is an image with an example of how CORREL is calculated for the range of Brand-1 (Range 1) and other brands (Range and Range 3).
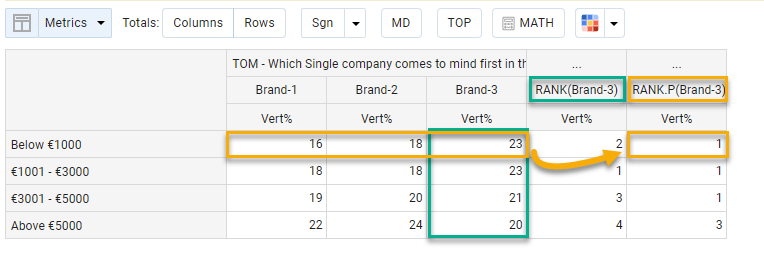
RANK and RANK P. calculations
Here, the ranking calculation range for brand 3 is highlighted in green, and the perpendicular ranking calculation range for brand 3 is highlighted in yellow. Thus, in the case of regular rank, the rank in the column is calculated. In the case of perpendicular, the rank within the row will be displayed in the column.