
To get started with your first crosstab, open any database. You'll automatically be redirected to the Data Visualization Interface (DVI), where you can begin working with tables and performing various operations.
You can kickstart your training by using our ready-made dummy datasets. These datasets are readily available to all registered users within our Sandbox
We recommend watching our short instructional video for a quick and clear demonstration of how to create a crosstab. It will guide you through the initial steps to help you get started seamlessly.
The summary:
When you open a database, the default state of the Data Visualisation Interface is the Crosstab mode.
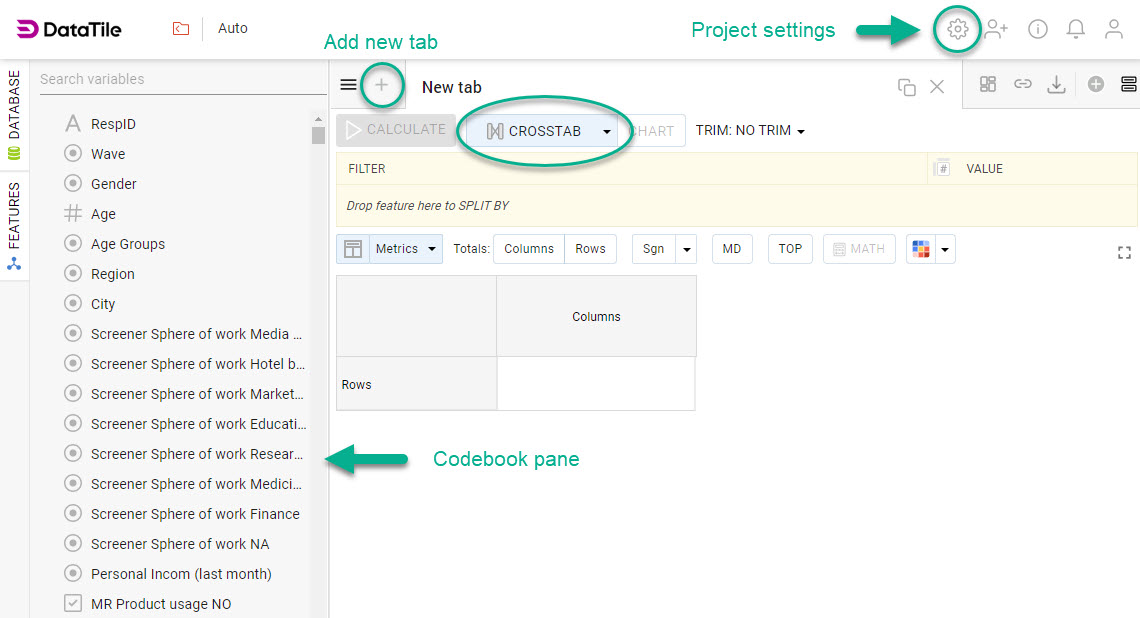
Located on the left side of the screen, the codebook pane contains all the variables that you can utilize when creating crosstabs.
To fill the crosstab:
-
Create a new tab to start a request;
-
Select the variables you want to analyze from the variable tree and add them to the crosstab by one of the methods:
-
simple drag&drop them onto the rows/columns of your table, choose ‘as list’ from the popup menu, and click ‘Calculate’;
-
to populate the rows double-click on the variable, to populate the columns - CTRL/CMD + double-click on the variable. In that case, the calculation is made automatically.
-
if you wish to change the variables in your rows, double-click on another variable and the system will automatically replace the rows in your crosstab. To replace the columns, CTRL/CMD + double-click on another variable.
Learn more about our on-drop operations in crosstabs.
-
-
Choose metrics you need to have in the crosstab. By default, it’s vertical %.
-
To add a significance test click on the ‘Sign’ button above the table. By default, DataTile applies a Z-test with a 5% confidence level to compare values against those in the Total column. Blue downward arrows indicate that the value is significantly lower than in the Total and red upward arrows indicate that the value is significantly higher.
After setting up your crosstab, you can further enhance your analysis by incorporating logical expressions, and mathematical operations. Building new requests remember to save your previous requests using decks. This way, you can easily return to them whenever needed.
When your first crosstab is ready you can also explore the exciting option of creating your first crosstab-based chart to visualize your data in a meaningful way.
Save or share your crosstab
In the top-right toolbar, you can find three icons that help you to save or share your crosstab.
-
Firstly, you can export the table to a dashboard, using the ‘Export to dashboard' icon.
-
Secondly, you can provide quick access to your crosstab for colleagues (who also have access to DataTile) using a shortcut link. You get the link by clicking on the ‘Shortcut’ icon.
-
And finally, you can download the table to PowerPoint, PDF, Excel, or as a PNG or JPEG image. Click on the ‘Download as’ icon and select the option from the submenu.