
Every database has its own list of metrics. The database owner decides which metrics users can choose, what they are called and how they are rounded. For what each metric means and how it is calculated, see Metrics and Statistics.
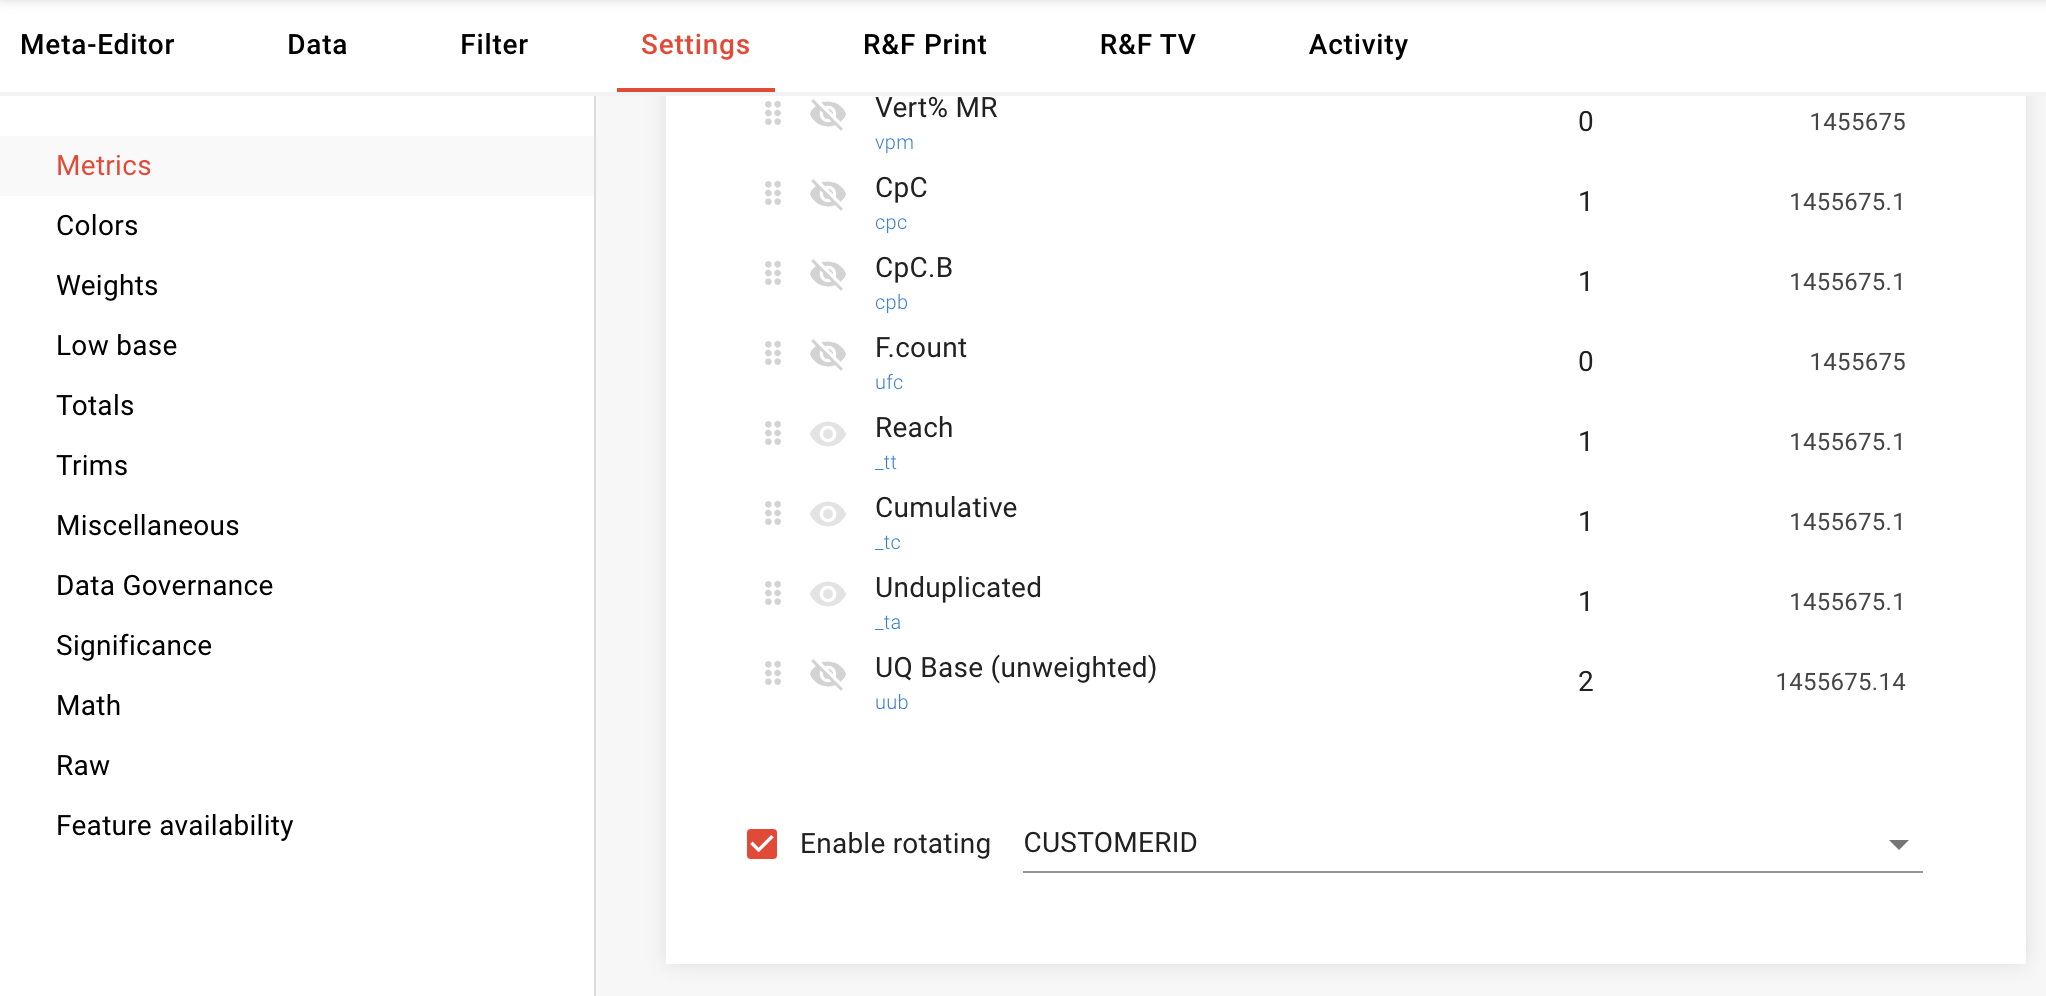
Go to Project settings → Settings → Metrics. Changes are saved automatically.

What you can change
-
Show or hide a metric: click the eye icon. Hidden metrics disappear from the Metrics menu of crosstabs, charts and dashboards; the Dashboard Data API lists them as not enabled and returns no values for them. Vert% and the TURF metrics cannot be hidden.
-
Rename a metric: double-click its name to edit the name (up to 32 characters) and the description. Users see the description when they hover over the metric in the Metrics menu. The line under the name shows the metric's ID, such as
vpt; the ID does not change. -
Decimals: double-click the number to set from −7 to 7 decimals. Negative values round to tens (−1), hundreds (−2) and so on. Users can still change decimals for a single column in a crosstab.
-
Order: drag a metric to change its position in the Metrics menu.
-
Enable rotating: tick the box at the bottom of the list and choose the ID variable to switch on the metrics for rotated data. See Rotated databases.

The rotated-data metrics (Cases, UQ Base, Pen, Total UQ Base, Total pen, UQ Base (unweighted)) are always listed here, but users see them only while rotation is enabled.
Views
A View has its own copy of the metric settings. To bring a View back in line with its database, open Reset in the View's settings: it copies the database's metrics, colours and rotation setting into the View.