
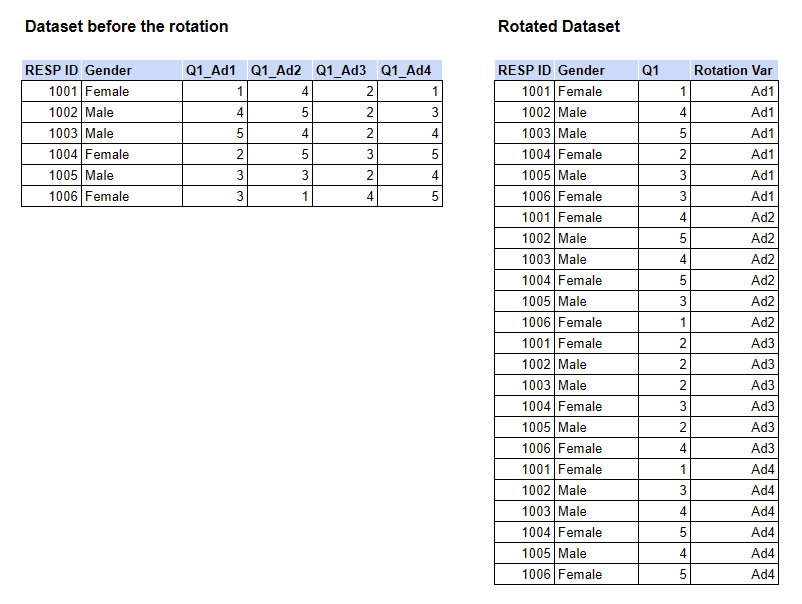
Rotated or looped databases are a method of recording data where each response to a specific variable in a survey is represented by a single row.
For example, in analyzing commercials, respondents respondents evaluate ads within a single questionnaire. Now we can rotate the database by ad evaluation variable, each row corresponds to one ad evaluation. As a result, the number of entries exceeds the number of respondents. Each respondent is recorded multiple times according to the number of evaluations, as shown below
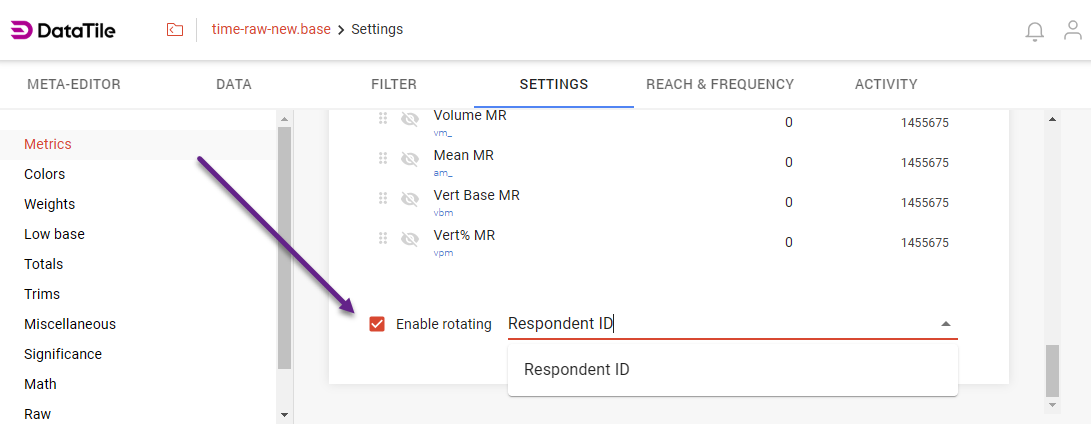
After uploading the rotated database to DataTile, we can specify in the settings that the database is rotated and use the appropriate metrics for rotated data.
How to specify rotated databases
-
Go to Project settings → Settings → Metrics;
-
Scroll down till the checkbox ‘Enable rotating’ is seen;
-
Tick the checkbox and select the variable in your dataset that contains the unique identifiers for respondents (or any variable you want to choose), usually, this is the ID;
-
Now the system recognizes that the database is rotated, and special metrics for rotated databases can be applied.
Metrics for rotated databases
-
Cases – number of unique cases in a dataset. A counterpart of Count metric for non-rotated bases.
Here's an example of how it works for a rotated database. When using the Count metric for a rotated dataset, the system counts the number of commercials evaluations made by male and female respondents, resulting in 4,515 evaluations made by males and 4,445 evaluations made by females. However, the actual numbers are 2,284 males and 2,206 females among the respondents, and these numbers we get using the Cases metric.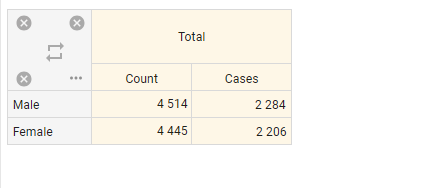
-
Pen – penetration, the share of cases for the column. A counterpart of Vert% metric for non-rotated bases;
-
UQ Base – all unique cases in the column. A counterpart of Vert Base metric for non-rotated bases;
-
Total UQ Base – all unique cases in the sample;
-
Total pen – share of cases among all unique cases;
-
Prob Share – probability share (for the cases when probabilistic variables are used).