
Three thresholds are possible when calculating significance in DataTile:
-
Confidence Level 90% (p<0.10);
-
Confidence Level 95% (p<0.05);
-
Confidence Level 99% (p<0.01);
To enable significance thresholds
-
Go to Project settings → Settings → Significance;
-
Tick the boxes of the threshold you need. You can use all 3 thresholds concurrently.
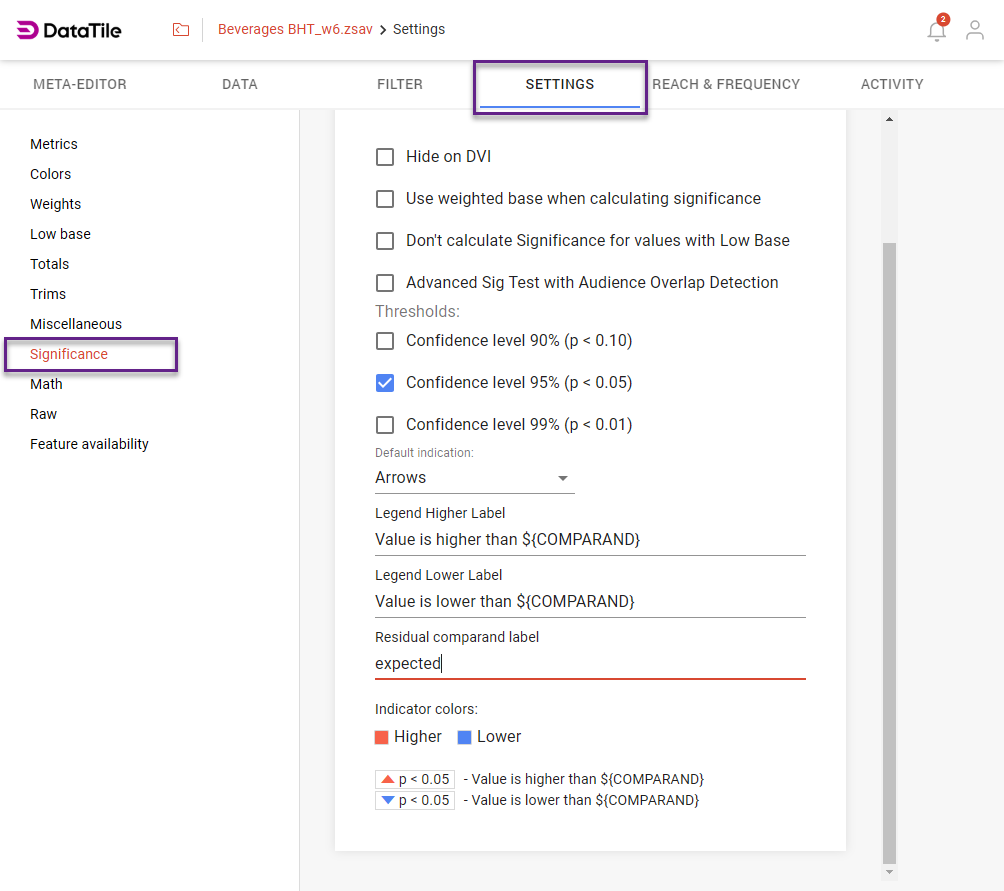
In the significance settings, you can adjust indicators, colors, and labels to display significance on a crosstab/chart. By default, these labels are used: ‘Value is higher than ${COMPARAND}’ or ‘Value is lower than ${COMPARAND}’. You can edit the labels on the appropriate lines.
Note that the indicator and color settings here only apply to the defaults, and if you change them on the crosstab, the newly made changes will take precedence.