
When it comes to analyzing data in crosstabs, metrics like Pearson's correlation coefficient can provide invaluable insights into the statistical relationships between variables in rows and columns. While the affinity index and statistical significance are commonly used in cross-tabulation, Pearson's correlation coefficient, often referred to as 'Correl', goes a step further by quantifying the strength of these relationships.
Interpreting the CORREL metric
-
Closer to 1 = Strong positive statistical link.
When Correl approaches 1, it signifies a strong positive statistical link. In other words, when one variable increases, the other tends to increase as well. This implies a significant correlation between the two variables. -
Closer to -1 = strong negative statistical link.
When Correl approaches -1, it indicates a strong negative statistical link. As one variable increases, the other tends to decrease, suggesting a significant inverse correlation. -
Closer to 0 = weak statistical link.
When Correl is close to 0, it suggests a weak statistical link between the variables. This means that there is little to no linear relationship between the variables, making it difficult to draw meaningful conclusions based solely on their correlation.
How Correl is calculated
Correl (cor) is Pearson's correlation coefficient between the row and the column of a cell, calculated from the respondents in the cell's base. It is weighted when a weight is active and shown with four decimals by default.
The calculation depends on the row variable:
-
Categorical row (the usual case): DataTile correlates two yes/no indicators, "the respondent is in this row" and "the respondent is in this column". This is the phi coefficient:
Correl = (Count × N − Horiz Base × Vert Base) ÷ √((N × Vert Base − Vert Base²) × (N × Horiz Base − Horiz Base²))where N is the total base of the table (respondents who answered both variables). Correl is positive when the row is more common in the column than in the table as a whole, which is when the Aff.idx is above 100.
-
Numeric row and numeric column: DataTile correlates the respondents' values of the two variables, using the respondents in the cell. If the column is categorical, every respondent in a cell has the same column value, so there is nothing to correlate and the cell stays empty.
If either variable has no variation in the cell (for example, everyone in the base is in the row), the coefficient is undefined and the cell stays empty.
Correl is not tested for significance.
Here is an example of CORREL metrics
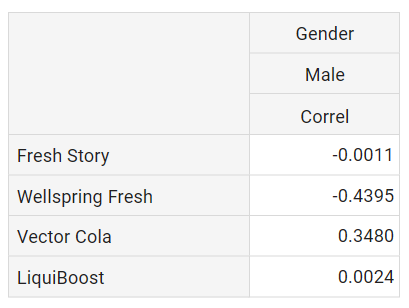
-
There is a strong positive statistical link between the consumption of Vector Cola and LiquiBoost and the male gender (value of Correl metric > 0).
-
However, for VectorCola the link is strong which means the consumption of VectorCola is more typical for men than the consumption of LiquiBoost (0.3480 > 0.0024).
-
Brands Fresh Story and Wellspring Fresh exhibit negative correlations with the male gender, suggesting that their consumption among men is less typical (value of Correl metric < 0).