
The Affinity Index shows how much more (or less) typical a characteristic is of a target group than of a reference population. It is widely used in marketing and media planning: an index of 150 means that the target group is 1.5 times as likely as the reference population to have the characteristic.
Formula
Aff.idx = Vert% of the cell ÷ reference share × 100
-
Vert% of the cell: the share of the target group (the column) in the row category.
-
Reference share: the share of the row category in the reference population. The three affinity metrics differ only in the reference population.
An index of 100 means the column matches the reference; above 100 the row is over-represented in the column, below 100 under-represented. The index is a ratio, not a percentage: compare indices with each other rather than read them on an absolute scale.
Example. 7.82% of the total sample buy Fresh Lane, but 15.1% of women in Europe do. The index is 15.1 ÷ 7.82 × 100 = 193: women in Europe are almost twice as likely to buy Fresh Lane as the sample overall.
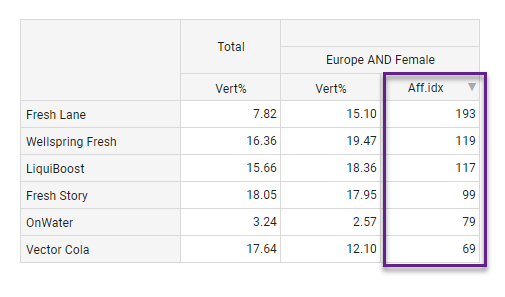
The three affinity metrics
|
Metric |
Reference population |
Use it when |
|---|---|---|
|
Aff.idx ( |
Everyone in the table: respondents who answered both the row and the column variable and meet both rebase conditions, within the filter. The reference share is Horiz Base ÷ that total. |
You compare each column with the table as a whole. |
|
Aff.idx (Unfiltered) ( |
The same, but calculated without the filter. The cell's Vert% still uses the filter. |
The filter defines your target group and you want to compare it with the full sample. Splits still apply. |
|
Aff.idx (Total) ( |
Everyone who answered the row variable and meets the row's rebase, within the filter. The column variable is ignored: respondents who did not answer it, or fall outside the column's rebase, stay in the reference. |
The column variable has missing values or a rebase, and you want the reference to be the whole population of the row question. |
If the column variable has no missing values and no rebase, Aff.idx and Aff.idx (Total) give the same result.
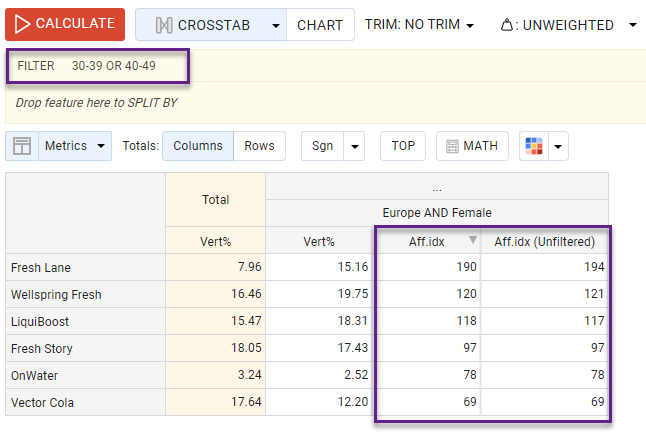
With a filter on age groups 30–39 or 40–49, Aff.idx compares Europe AND Female with the filtered sample (Total Vert% 7.96 for Fresh Lane), while Aff.idx (Unfiltered) compares it with the whole sample (7.82):
Notes
-
All three are off by default and shown without decimals. Switch them on in Metric settings.
-
Each affinity metric is calculated on its own; it does not need Vert% or any other metric to be shown.
-
When the column's Vert Base is zero, the index shows 0.
-
Affinity indices are not tested for significance.