
The three most commonly used metric groups that most tables are built from:
-
Count: Count, Sample count, Count MR.
-
Base: Vert Base, Horiz Base, Unweighted Base, Unweighted Horiz Base, Vert Base MR.
-
Percentage: Vert%, Horiz%, Base%.
Metrics in DataTile are ready-to-use calculations you can select in a crosstab to display the required value immediately. This article explains the most popular metrics in more detail and describes how DataTile calculates each one.
You can enable or disable metric visibility in the database settings. For the full list of available metrics, see the Metric Settings article.
Count
Count (cnt) represents the number of respondents who belong to both the row and column categories, taking into account any applied filters and splits. With a weight active, each respondent counts with their weight, so Count is the weighted number of respondents.
A respondent is counted once per cell. In a net (a group of categories) or a multi-response row, a respondent who chose several categories is still counted once. To count answers rather than respondents, use the Count MR metric; see Multi-response metrics.
Sample Count
Sample Count (sct) is сount without weighting: the actual number of interviews behind the cell. Use it next to weighted results to see how many people a number rests on.
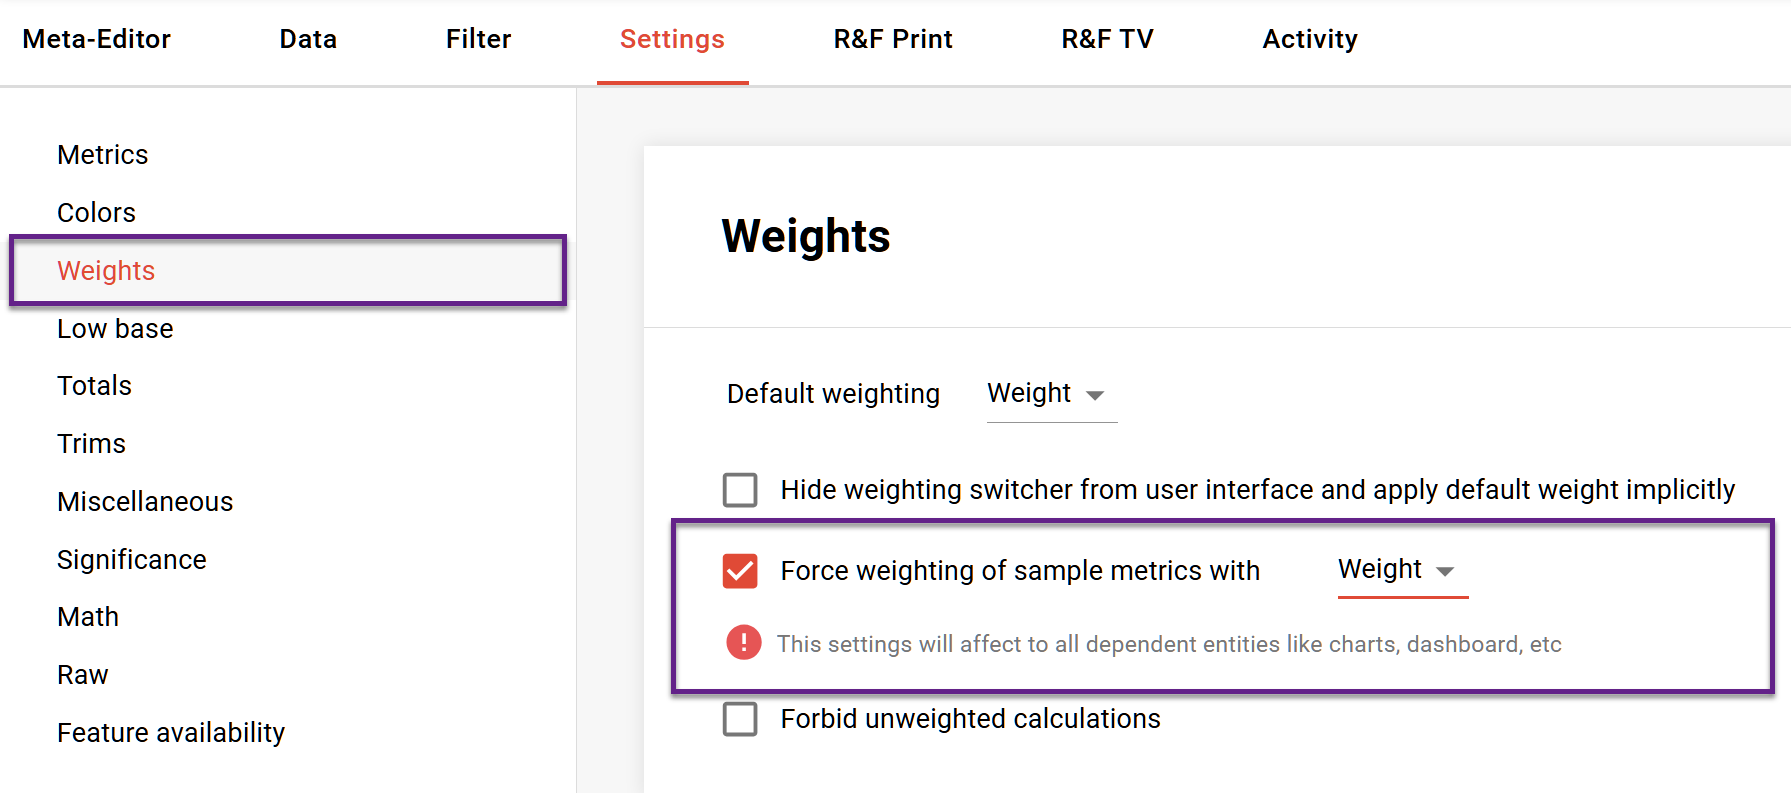
If the database has a weight under Force weighting of sample metrics (Project settings → Settings → Weights), Sample Count, Unweighted Base, and Unweighted Horiz Base use that weight instead, whatever weight the user selected.
Vert Base and Horiz Base
Vert Base (vbs) is the base of a column: the respondents in that column who belong to the base of the row variable. A respondent is in the base of the row variable when:
-
they answered the row variable (when missing values are ignored, which is the default);
-
they meet the rebase condition of the row, if there is one;
-
they meet the rebase condition of the column, if there is one;
-
they pass the filter and belong to the split.
Horiz Base (hbs) is the mirror image: the respondents in a row who answered the column variable and meet both rebase conditions.
Because the row's rebase is part of Vert Base, rows with different rebases have different Vert Bases in the same column. If every row shares the same base, Vert Base is the same number on every row.
If missing values are counted (the Ignore sysmis option is off for the variable), respondents without an answer stay in the base.
Unweighted Base and Unweighted Horiz Base
Unweighted Base (sbs) and Unweighted Horiz Base (shb) are Vert Base and Horiz Base without weighting. Use them to check whether a base is large enough to report.
If the database has a weight under Force weighting of sample metrics (Project settings → Settings → Weights), Sample Count, Unweighted Base, and Unweighted Horiz Base use that weight instead, whatever weight the user selected.
Vert%, Horiz% and Base%
Every percentage in DataTile is a count divided by a base, so knowing which respondents are in the base explains almost every number you see.
|
Metric |
Formula |
Answers the question |
|---|---|---|
|
Vert% ( |
Count ÷ Vert Base × 100 |
What share of this column is in this row? For example, what share of men prefer brand A. |
|
Horiz% ( |
Count ÷ Horiz Base × 100 |
What share of this row is in this column? For example, what share of brand A's fans are men. |
|
Base% ( |
Count ÷ total base × 100 |
What share of the whole table is in this cell? |
The total base of Base% is everyone who belongs to the base of both variables: they answered the row variable and the column variable, and meet the rebase conditions of the row and the column. It is not the sum of the visible cells: hidden categories and nets do not change it.
Vert% cannot be switched off; it is the default metric of every new query.
Worked example
Ten respondents answered a gender question. Eight of them also answered "Which brand do you prefer?"; two (one man, one woman) skipped it.
|
Brand |
Men (6) |
Women (4) |
Total |
|---|---|---|---|
|
A |
3 |
1 |
4 |
|
B |
2 |
2 |
4 |
|
No answer |
1 |
1 |
2 |
Crosstab with brand in rows and gender in columns, missing values ignored (default):
|
Row |
Metric |
Men |
Women |
Total |
|---|---|---|---|---|
|
A |
Count |
3 |
1 |
4 |
|
Vert Base |
5 |
3 |
8 |
|
|
Vert% |
60% |
33% |
50% |
|
|
Horiz% (Horiz Base 4) |
75% |
25% |
100% |
|
|
Base% (total base 8) |
37.5% |
12.5% |
50% |
|
|
B |
Count |
2 |
2 |
4 |
|
Vert% |
40% |
67% |
50% |
|
|
Base% |
25% |
25% |
50% |
-
The men's Vert Base is 5, not 6: the man who skipped the brand question is not in the base.
-
If missing values are counted for the brand variable, the men's Vert Base becomes 6 and brand A drops to 3 ÷ 6 = 50%.
-
If the brand row were rebased to "aware of brand A" and only four men were aware, the men's Vert Base for that row would be at most 4.