
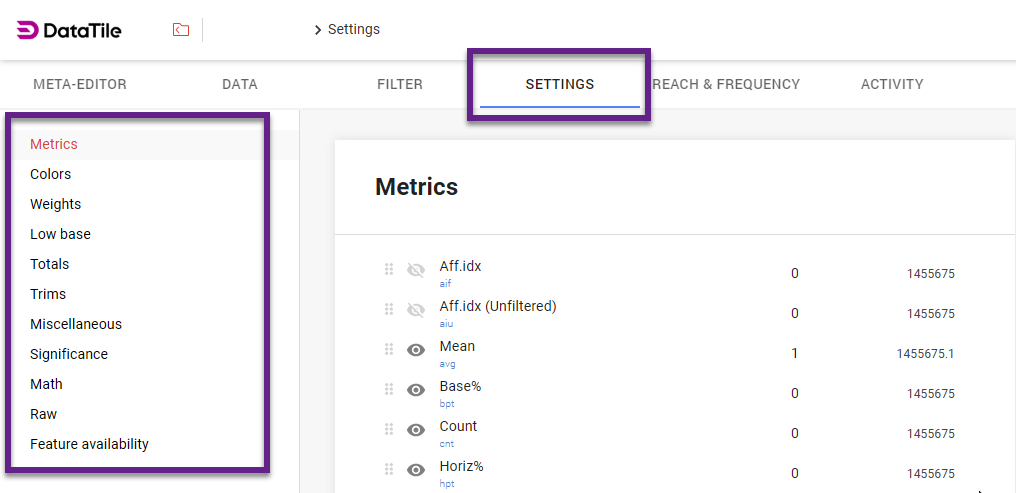
When working with a database, you can go to the database settings by clicking on the ‘cog’ icon ![]()
-
Metrics: here you can customize metrics used in your project (read more about metrics in DataTile);
-
Colors: here you can set the default color palette. The order of the colors sets the order of chart series coloring;
-
Weights: here you can configure the weighting parameters of your project. Read more here.
-
Low base: here you can configure up to two thresholds to explicitly warn users about low levels of the sample base on all charts and tables. Having a value below the threshold points on charts or values in table cells will be highlighted with corresponding colors;
-
Totals: here you can set the dimensions for total calculation in crosstabs (for rows/columns/both) and rename the options if you need to;
-
Trims: here you can rename the trimming options and manage the trim button visibility on DVI;
-
Miscellaneous: you can choose a separator for the weighted count metric. Also, you can manage settings for export and displaying Tracking ID;
-
Significance: here you can set the significance thresholds and adjust the comparison settings' label descriptions and other parameters.
-
Math: you can set the MATH calculator visibility on DVI;
-
Raw: here are some settings for displaying raw data on DVI;
-
Feature availability (read below).
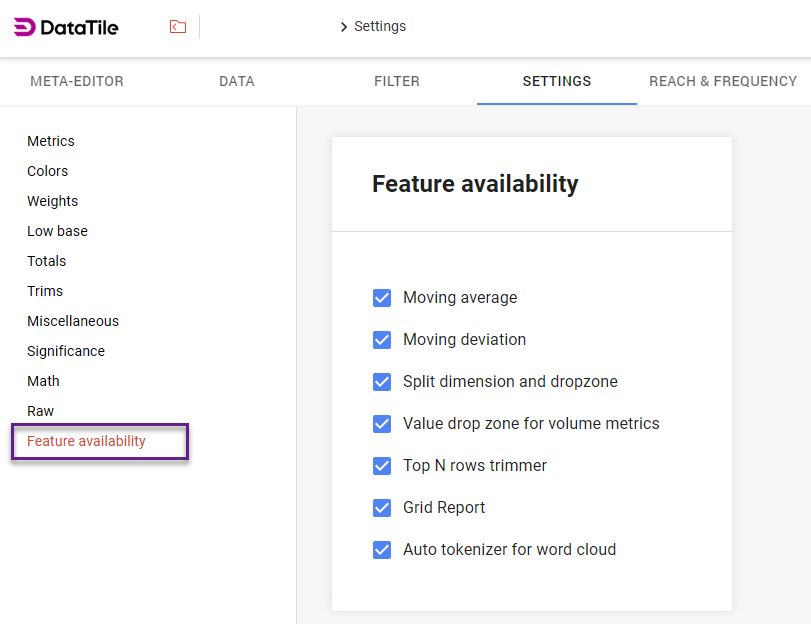
Feature availability checkboxes
-
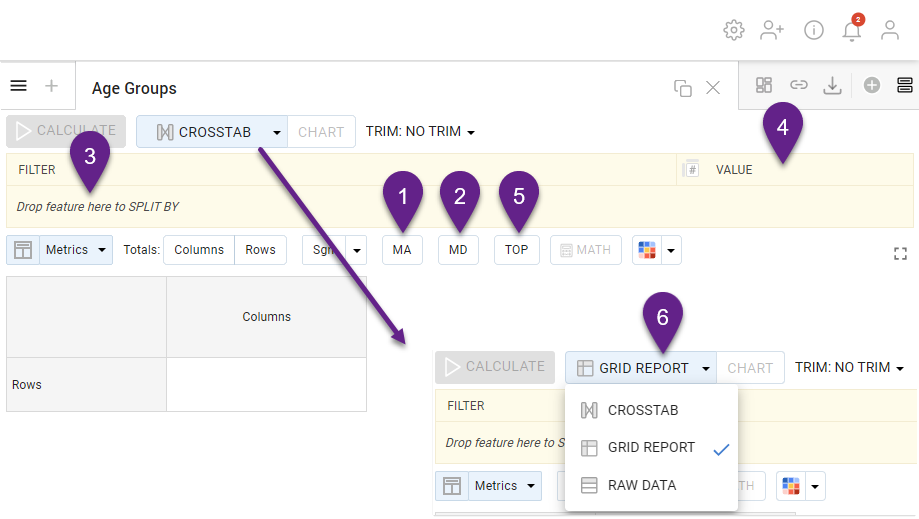
Activates Moving average button visibility on DVI;
-
Activates Moving deviation button visibility on DVI;
-
Activates Split dimension and dropzone on DVI;
-
Activates Value dropzone for volume metrics on DVI;
-
Activates Top N rows trimmer on DVI;
-
Activates Grid Report on DVI.
Auto tokenizer for Word Cloud activates the text variable settings and splits the text content into individual words to display them in the Word Cloud chart.