
The 'Trim' function helps manage zero-values or missing data by either leaving a gap or omitting the data point, offering flexibility in chart presentation.
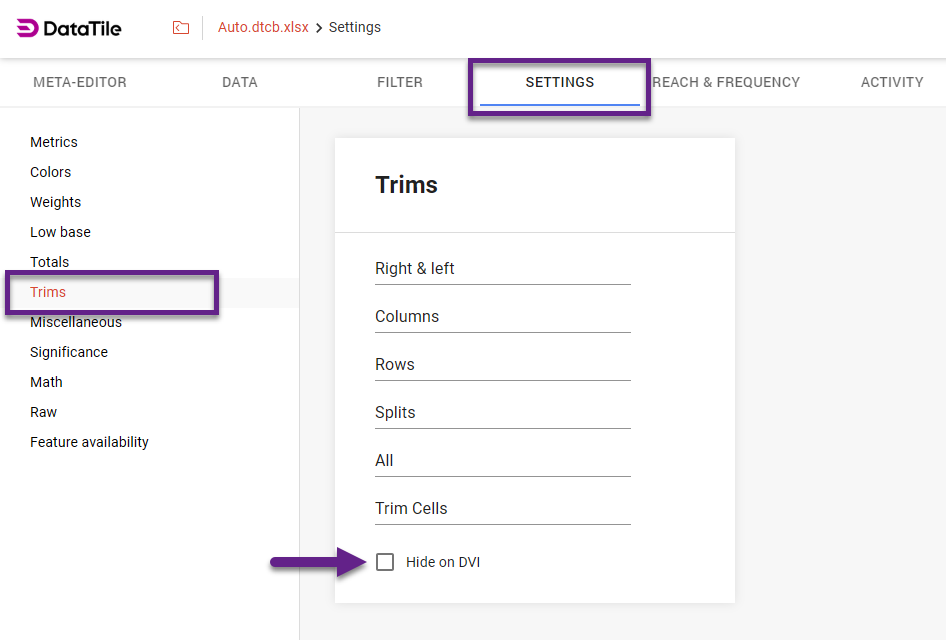
Going to Project settings → Settings → Trims, you can:
-
rename the trim options;
-
enable or disable this functionality using the ‘Hide on DVI’ checkbox.
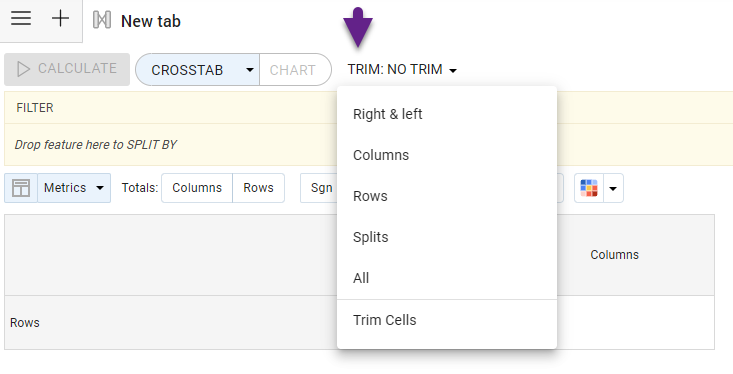
Trim options
-
Right & Left: removes data points with missing data or zero values from both the right and left sides of a series. Useful when data appears intermittently within a series.
-
Columns: removes entire columns that contain missing or zero values.
-
Rows: removes entire rows that contain missing or zero values.
-
Splits: if splits are added to your chart, this option removes or hides specific data points with missing or zero values within the splits.
-
Rows & Columns: simultaneously removes both rows and columns containing missing or zero values.
-
Trim Cells: removes individual cells based on selected conditions and can be used in combination with other trim options.
To use trim tells:-
Choose a specific metric from the dropdown list (e.g., Vert%, Mean, Sum, etc.).
-
Use angle brackets (<, >, <=, >=) to define the trimming rule.
-
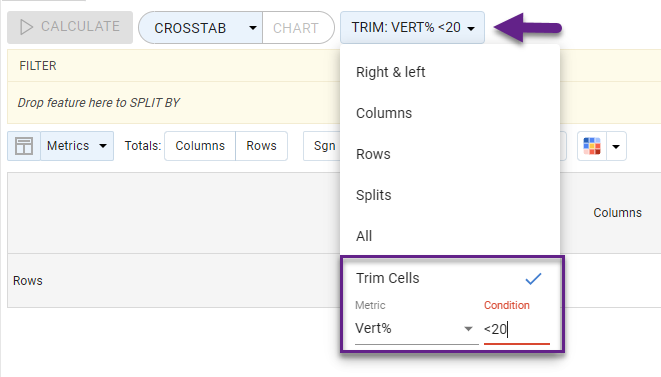
The selected trim option remains indicated above the crosstab.