A pie chart is a type of circular chart divided into sectors, each representing a proportion of the whole.
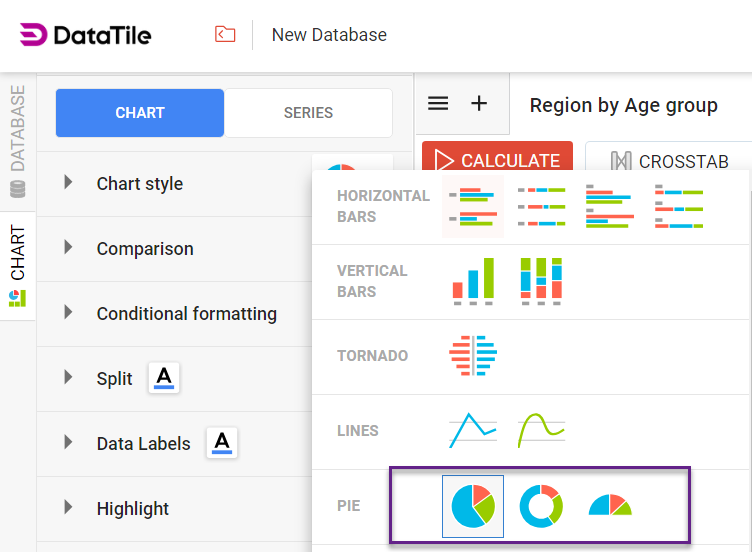
DataTile offers several types of pie chat:
-
Standard Pie Chart - the basic form of a pie chart, displaying data as slices of a circle where each slice represents a proportion of the whole.
-
Donut Chart - similar to a pie chart but with a hole in the center. This space can be used for additional information or to improve readability.
-
Semicircle Chart - displays data in a half-circle format, where each slice represents a proportion of the whole, similar to a pie chart but cut in half.
How to create the Pie chart
-
Switch to chart mode and select the Pie chart type.
-
Select the label's position.
-
Change the position, direction, or visibility of the series using the Series submenu. You can also change the variables' visibility by clicking on them directly on the chart.