
A confidence interval indicates the level of certainty associated with the values displayed in a chart. Instead of just showing a single number, it provides a range in which the true value is likely to fall. The setting used is a 95% confidence interval.
To display the confidence interval in DataTile
-
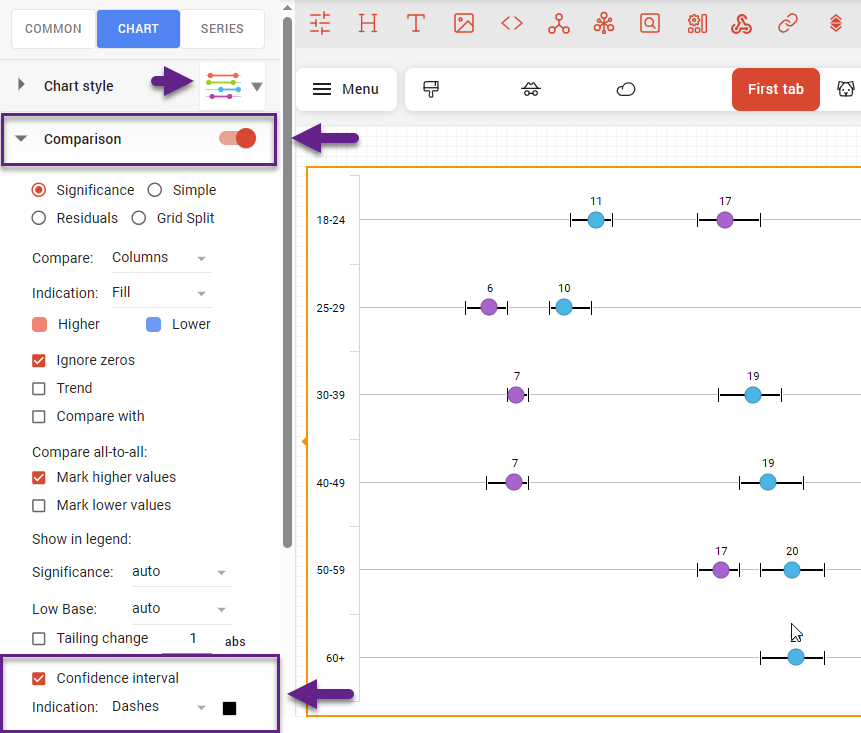
Select the dot plot chart type and enable the ‘Comparison’ toggler.
-
Check the ‘Confidence interval’ box in the ‘Comparison’ section.
-
Select the color of the indicators.
On a dynamic chart or dashboard, the display of the confidence interval is accompanied by a tooltip indicating the extreme values when hovering over the indicator.