The 'trim' function in charting allows you to address zero-values or missing data by either leaving a gap or omitting the data point, providing flexibility in chart presentation.
Trim options can be switched on/off in the Database settings:
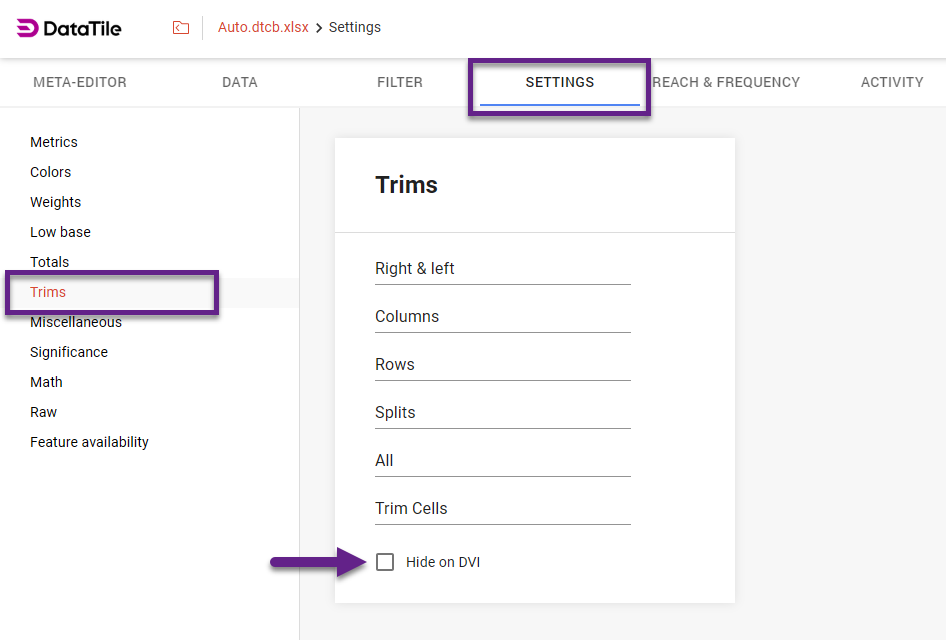
Trim options
-
Right & Left: This option removes columns or data points with missing data or zero values from both the right and left sides of the chart, trimming the chart horizontally.
-
Columns: This option can remove entire columns from the chart that contain missing data or zero values.
-
Rows: This option likely removes entire rows from the chart that contain missing data or zero values.
-
Splits: If you have any splits added to your chart then this option can remove or hide specific data points with missing data or zero values within the splits.
-
Rows & Columns: This option simultaneously removes both rows and columns with missing data or zero values.
-
Trim Cells: This option removes individual cells from the chart based on your selected conditions, and can be used alongside the other trim options.
Begin by selecting a specific metric from the dropdown list, then add a condition for the trim using angle brackets (<>). For example, to remove all values below 20 select Vert% and type <20.
See the short video below for a demonstration of the use of Trim Cells:
Break line at zero for line charts/area charts
There are two strategies for displaying missing/zero values when they are inside a line or area chart:
-
The line breaks at zero value:

-
The line continues at zero value:

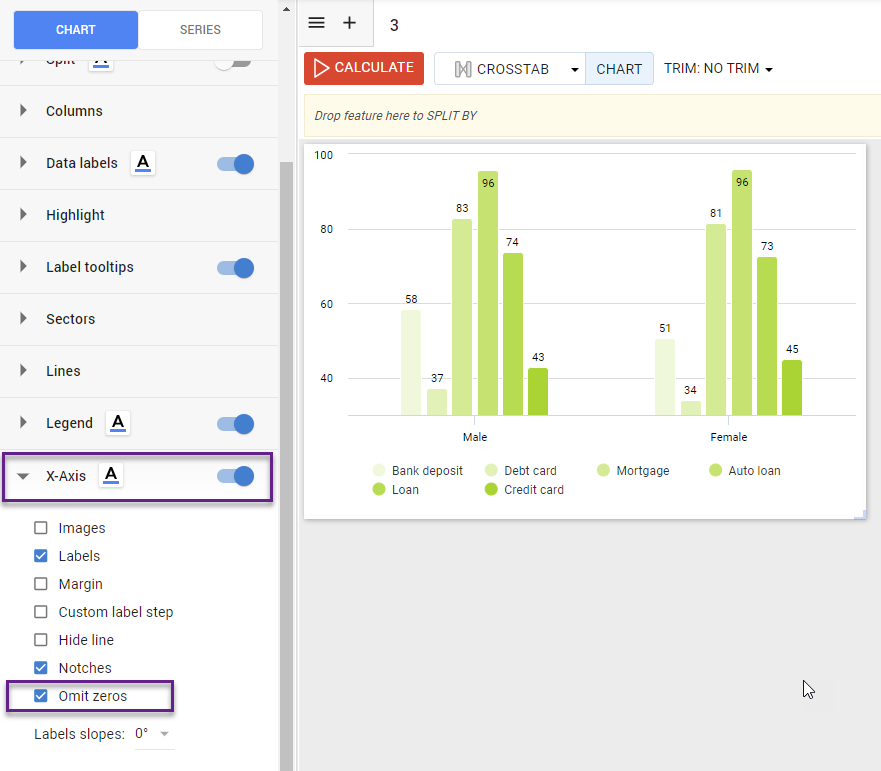
By default, DataTile uses the second option (line continues at zero value). If you want the line to break at zero value, go to the X-Axis section of the chart menu and tick the checkbox ‘Omit zeros’.