
The February updates bring powerful enhancements designed to streamline workflows and give you greater analytical control:
-
built-in NPS calculation,
-
cross-dashboard tab copying,
-
improved loaded data management,
-
new metric UQ Base (unweighted),
-
new MATH functions REF and Normalize,
-
and low base indication for Residuals.
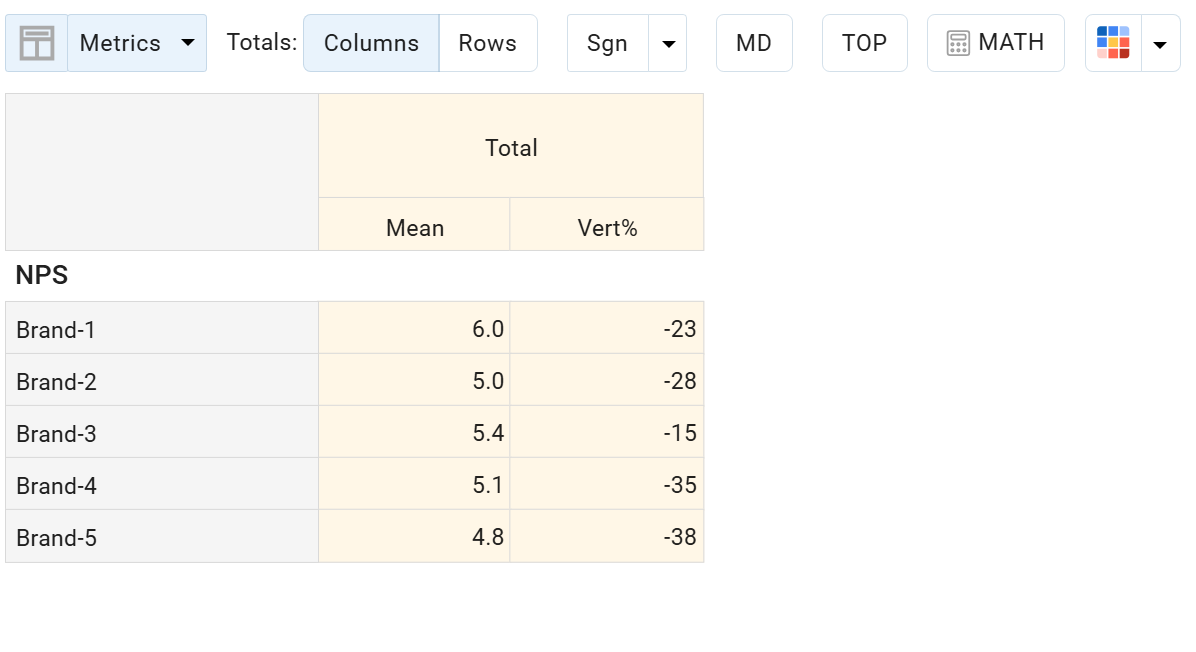
NPS
DataTile now offers a built-in option to create an NPS variable with automatic index calculation. Instead of manually recoding, users can generate an NPS variable directly in the Meta-Editor, similar to creating an MR-set. Once added to a crosstab, selecting Vert% displays the NPS score automatically, while the ‘Mean’ metric displays the Mean score.
This feature simplifies implementation and allows for the use of more advanced methods of significance testing.
Copy tabs between dashboards
We’ve introduced a convenient new feature that allows you to copy tabs across dashboards – perfect for teams building multiple similar dashboards or working in distributed environments.
To copy a tab, you must have Editor access to both dashboards:
Open the left menu → select the tab → click the ‘snowman’ icon and select Copy to → choose the target dashboard from the list → confirm.
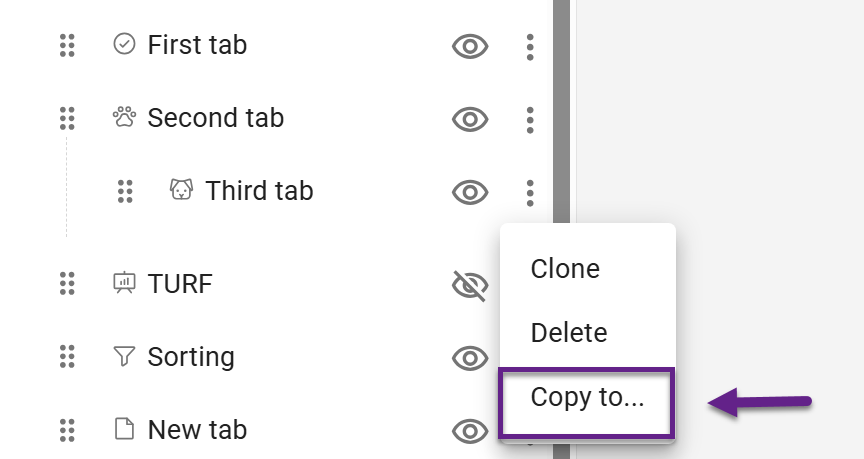
The copied tab is added to the end of the target dashboard’s menu and is hidden by default.
All logic is preserved during copying: database connections, controls, contexts, and reports.
DATA Panel Updates
The upgraded DATA panel gives you more transparency and control over uploaded volumes. You can now view detailed information for each volume, upload files via drag-and-drop, and delete multiple volumes at once. These improvements make managing and maintaining your database faster, clearer, and more efficient.
New metric: unweighted base for rotated bases
The range of available metrics has been expanded. A new metric UQ Base (unweighted) returns the unweighted base for rotated bases, providing greater transparency and analytical flexibility when working with rotated datasets.
New MATH functions: REF and Normalize
We’ve introduced two new mathematical functions to expand your calculation capabilities:
-
The REF function allows you to reference a specific row or column position (FIRST or LAST), regardless of which data is placed there. This makes it especially useful for joint charts or scenarios where data is dynamically changed via controls. Since REF is not tied to a specific variable, calculations remain stable even when the chart structure changes.
-
Normalize: calculates the share relative to the data currently present in the crosstab (i.e., normalizes based on visible results at that moment).
These additions provide more control when building advanced analytical logic.
Low base indication for residuals
You can now enable low base indication for Residuals.
To activate it, go to:
Settings → Low base → Show for residuals
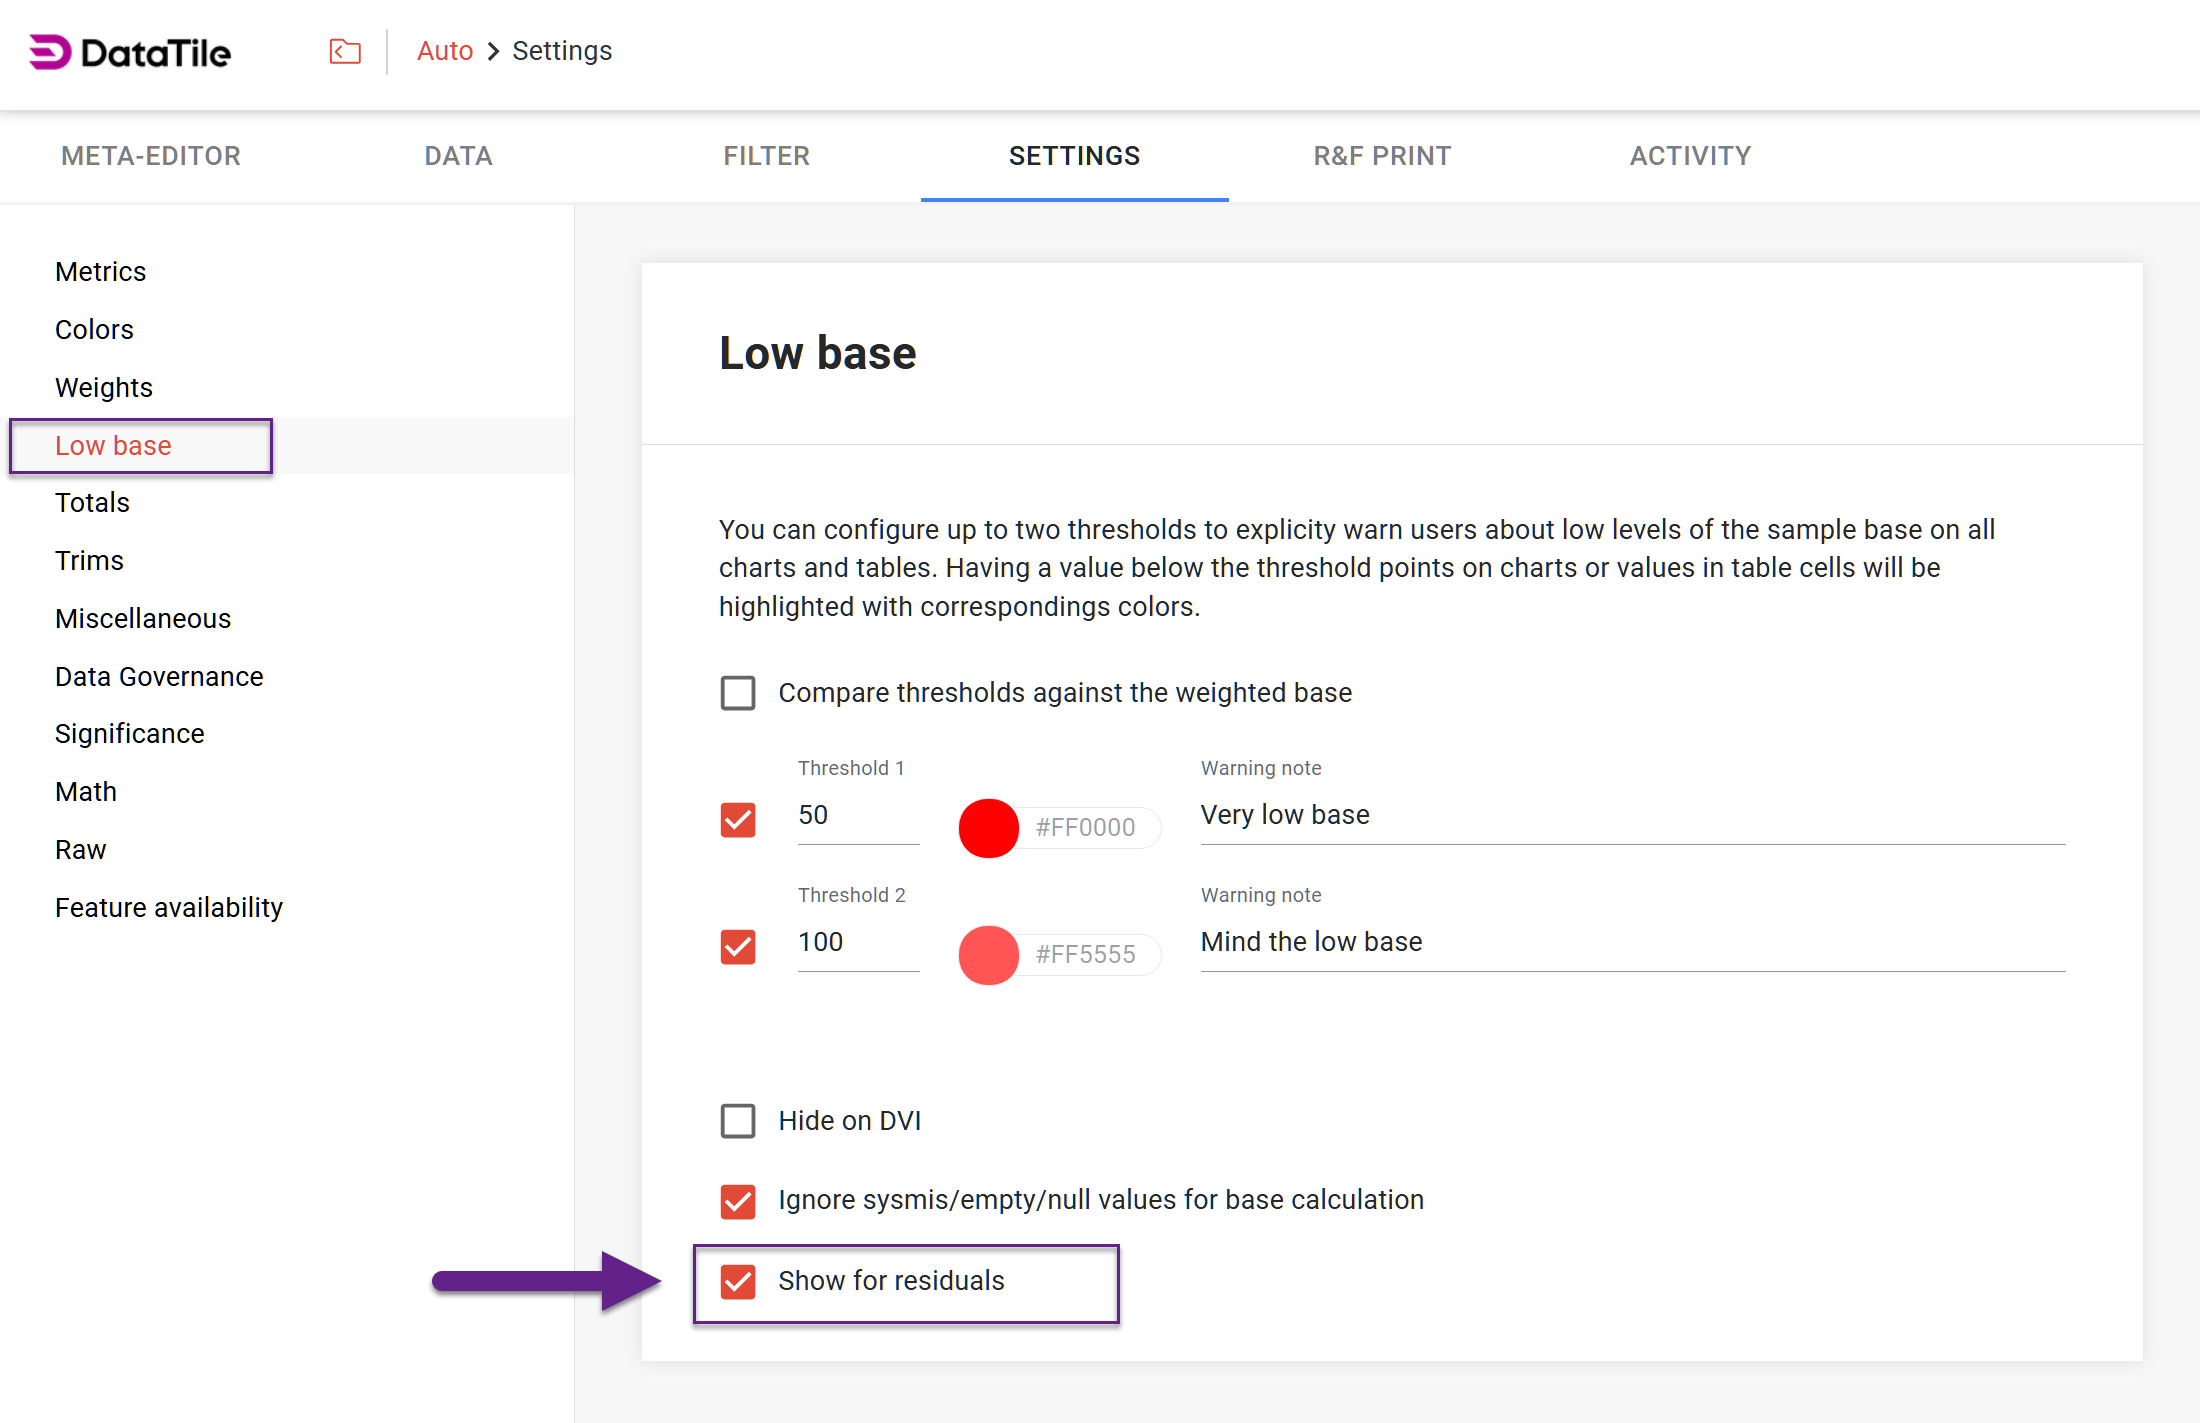
This ensures that low base warnings are also applied to residual values in both the crosstab and the correspondence analysis module, improving clarity in statistical interpretation.