
In July, our team completed a major update to the more advanced version of the codebook. A substantial amount of work was done, and in addition, we are introducing a new type of chart-to-chart interaction on the dashboard. The implementation of the new features aims to reduce repetitive tasks, speed up processes, and improve workflow at DataTile.
Codebook v.2
Codebook v.2 is a more advanced and user-friendly tool for loading the data map.
August 2025 will be a transition period during which both the new and old versions of the codebook can be used. After that, the codebook v.2 will become the main and only version.
Key changes
|
v.1 |
v.2 |
|---|---|
|
Required the full database structure declaration; no incremental loading was allowed |
Incremental loading is supported: you can upload a file with only the required columns, and it's no longer necessary to include every variable/value. This simplifies and speeds up the process of loading and adding new variables and categories. |
|
The declaration of variables and their values occurred on a single codebook tab. |
The declaration of variables and their values occurs on different codebook tabs - now we have the Variables tab and the Values tab |
|
The rigid structure required that variables be described above their values; otherwise, the correctness of the import could be compromised. |
Since the description of variables and values is on separate tabs, the order is not important. Additionally, the order in which variables are listed does not matter; it will only determine their position in the list after loading. |
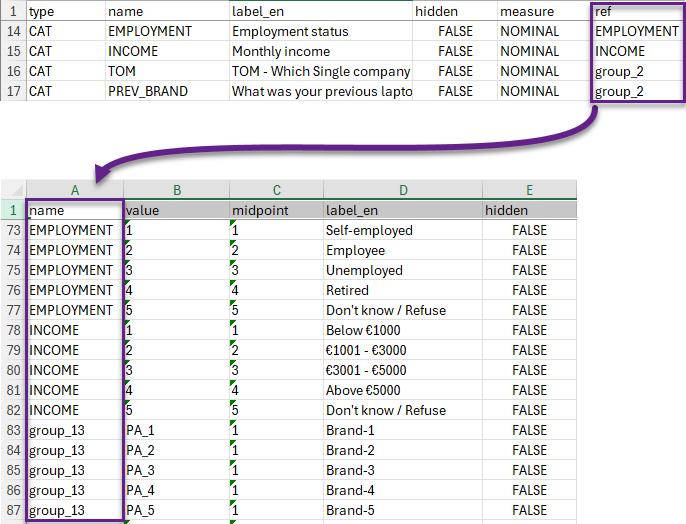
The variable is declared in the Variables tab, and its categories are declared in the Values tab. The connection between them is established using the ref column. The name specified on the Values tab must exactly match the ref used on the Variables tab to ensure correct linkage.
Please, read the detailed article about Codebook v.2.
Source chart
A chart-to-chart interaction on dashboards or the source chart is designed to simultaneously replace the options on the axes of the linked charts, following the ‘Put On’ principle.
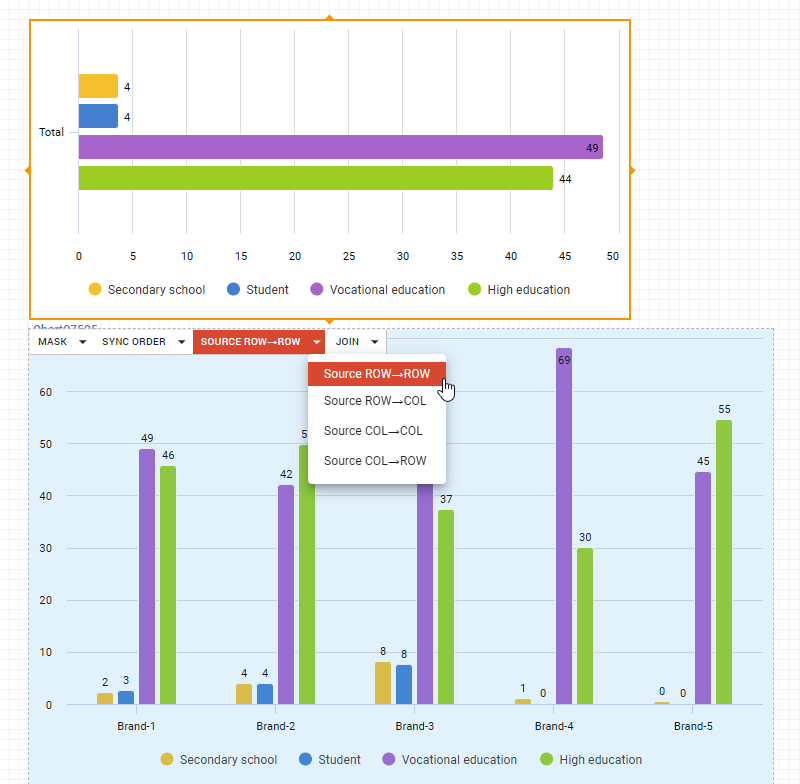
Creating one chart with certain options, you can assign it to many others as ‘Source’. In this way, by adjusting the options of a single chart (such as masking, trimming, etc.), you can simultaneously apply those changes to multiple other charts.
The key advantages of this feature include a significant reduction in time and resources for chart synchronization, minimizing the number of controls, and eliminating the risk of human error.