When exporting to Excel, the dashboard is presented as a series of tables.
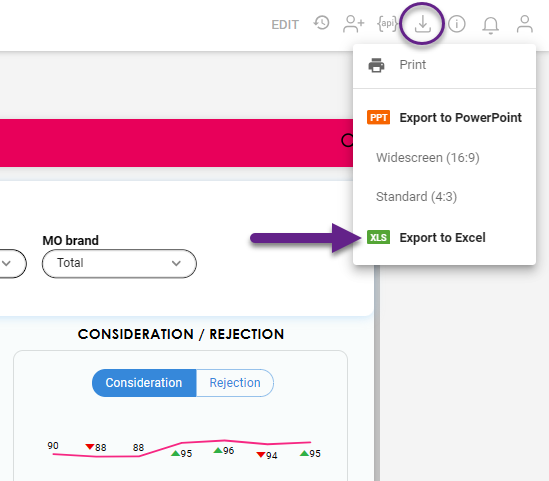
To export a dashboard, use the ‘Export’ icon in the toolbar and select ‘Export to Excel’.
Key points
-
Only the active dashboard tab, the one open in VIEW mode at the time of export, is included in the Excel file.
-
Each chart is exported as a separate table in its tab. The tab labels in Excel match the titles of the corresponding widgets. Even if the title is not visible (deactivated), it will be used in Excel. If chart names are duplicated, numbering will be added to them after export.
-
The export reflects the state of the controls at the moment of export.
-
Controls themselves are neither exported nor displayed in Excel.
-
Applied filters and weights will be displayed in the chart information section above the table in Excel.
-
All formatting, including comparison, highlight, and heatmap, is exported similarly to how it appears on the dashboard.
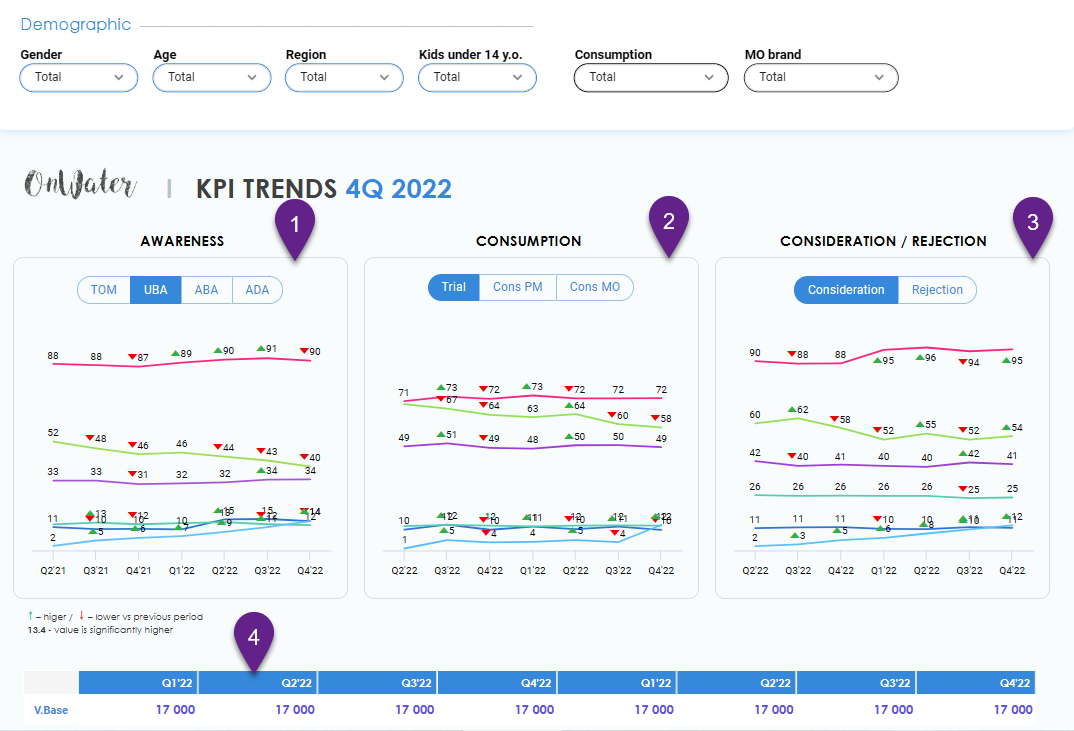
Here is an example of how this dashboard tab, containing four widgets, can be exported to Excel.
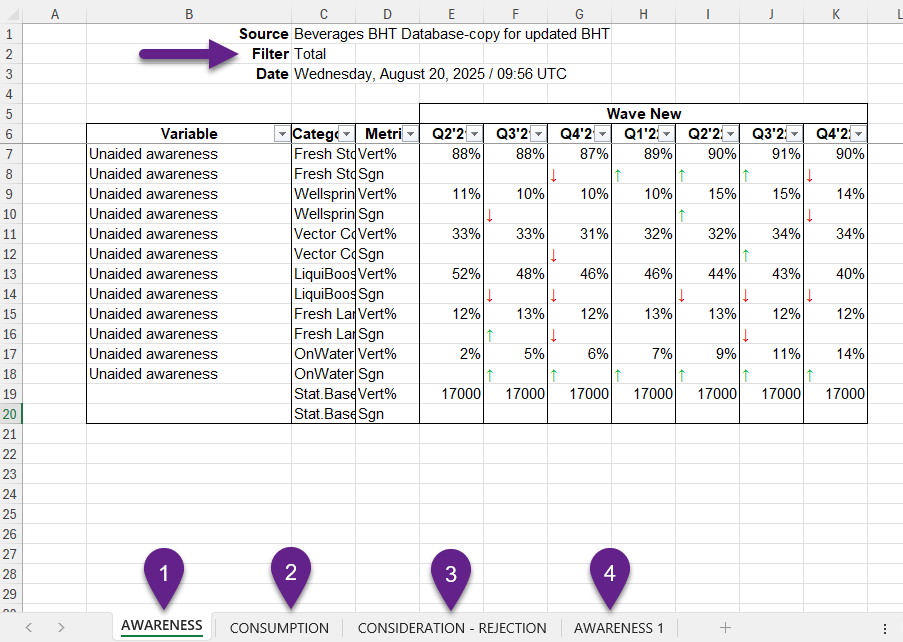
After exporting, we got an Excel file with four tabs. The applied filter is indicated above. Significance indication (arrows) is shown accordingly.
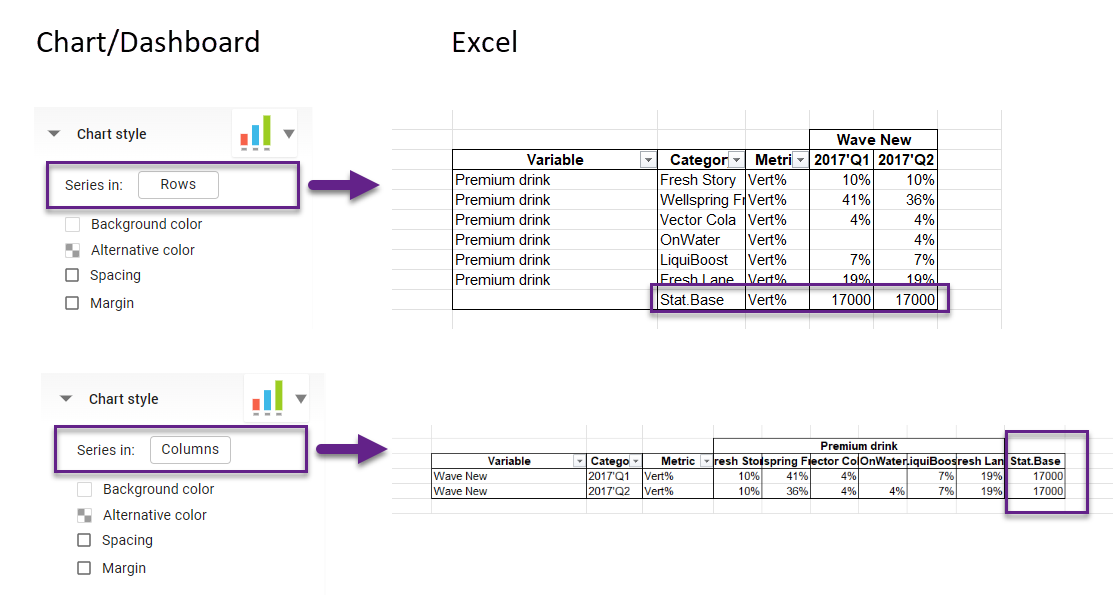
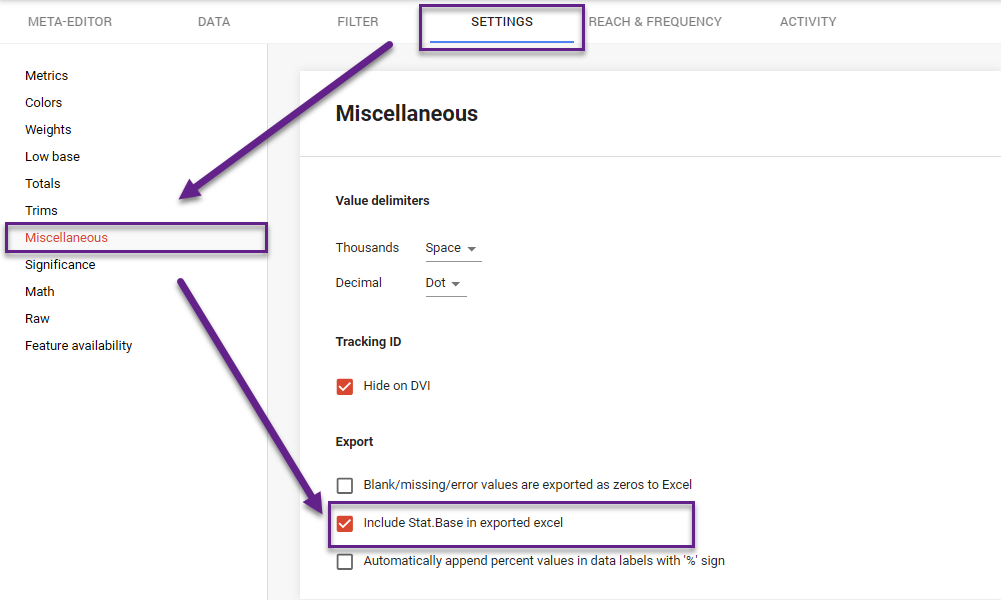
Statistical Base in Exported Excel
When exporting charts as tables, you can add a row or column containing the Stat.Base value. Even if it’s not visible on the dashboard, it will be included in the Excel export.
To activate this automatic option,
-
go to the Database Settings → Settings → Miscellaneous;
-
tick the checkbox ‘Include Stat.Base in exported Excel’.
The export respects the selected orientation for options: if series are set to columns, Stat.Base will appear in a column; if set to rows, it will appear in a row accordingly.