
This article is part of the DataTile series on Significance Testing.
· For means · Independent groups · Unpooled variance
· Appropriate for large samples (30+)
As outlined in the “Before You Test” article, all statistical tests in DataTile are designed for independent samples — we never compare paired or dependent observations.
To compare numeric values (e.g., average spend or satisfaction scores), DataTile applies a Z-approximation of Welch’s t-test, assuming unequal variances between groups (unpooled). This method is appropriate for large samples and avoids risky assumptions about equal spread.
For clarity and transparency, we also include the formulas for the pooled variance version of the test, but this variant is not used in DataTile and is shown here only for educational comparison.
Step-by-Step: T-Test Algorithm
1. Calculate the Sample Means
Let the two groups being compared be:
-
![]() - first group
- first group -
![]() - second group
- second group
Calculate sample means as:
-
![]() - sample mean of
- sample mean of
![]()
-
![]() - sample mean of
- sample mean of
![]()
'%3e%3cg transform='translate(167%2c0)'%3e%3cg transform='translate(-13%2c0)'%3e%3cg transform='translate(0%2c26)'%3e%3cg transform='translate(0%2c-184)'%3e%3cuse transform='scale(0.707)' xlink:href='%23MJMAIN-AF' x='-70' y='0'%3e%3c/use%3e%3cuse transform='scale(0.707)' xlink:href='%23MJMAIN-AF' x='-195' y='0'%3e%3c/use%3e%3c/g%3e%3cg transform='translate(304%2c0)'%3e%3cuse xlink:href='%23MJMAIN-78' x='0' y='0'%3e%3c/use%3e%3cuse transform='scale(0.707)' xlink:href='%23MJMAIN-31' x='747' y='-213'%3e%3c/use%3e%3c/g%3e%3cuse xlink:href='%23MJMAIN-3D' x='1564' y='0'%3e%3c/use%3e%3cg transform='translate(2343%2c0)'%3e%3cg transform='translate(397%2c0)'%3e%3crect stroke='none' width='834' height='60' x='0' y='220'%3e%3c/rect%3e%3cuse transform='scale(0.707)' xlink:href='%23MJMAIN-31' x='339' y='602'%3e%3c/use%3e%3cg transform='translate(60%2c-345)'%3e%3cuse transform='scale(0.707)' xlink:href='%23MJMAIN-6E' x='0' y='0'%3e%3c/use%3e%3cuse transform='scale(0.5)' xlink:href='%23MJMAIN-31' x='787' y='-213'%3e%3c/use%3e%3c/g%3e%3c/g%3e%3c/g%3e%3cg transform='translate(3862%2c0)'%3e%3cuse xlink:href='%23MJSZ1-2211' x='0' y='0'%3e%3c/use%3e%3cg transform='translate(1056%2c477)'%3e%3cuse transform='scale(0.707)' xlink:href='%23MJMAIN-6E' x='0' y='0'%3e%3c/use%3e%3cuse transform='scale(0.5)' xlink:href='%23MJMAIN-31' x='787' y='-213'%3e%3c/use%3e%3c/g%3e%3cg transform='translate(1056%2c-287)'%3e%3cuse transform='scale(0.707)' xlink:href='%23MJMAIN-69' x='0' y='0'%3e%3c/use%3e%3cuse transform='scale(0.707)' xlink:href='%23MJMAIN-3D' x='278' y='0'%3e%3c/use%3e%3cuse transform='scale(0.707)' xlink:href='%23MJMAIN-31' x='1057' y='0'%3e%3c/use%3e%3c/g%3e%3c/g%3e%3c/g%3e%3c/g%3e%3c/g%3e%3c/g%3e%3c/svg%3e)
'%3e%3cg transform='translate(167%2c0)'%3e%3cg transform='translate(-13%2c0)'%3e%3cg transform='translate(0%2c26)'%3e%3cg transform='translate(0%2c-184)'%3e%3cuse transform='scale(0.707)' xlink:href='%23MJMAIN-AF' x='-70' y='0'%3e%3c/use%3e%3cuse transform='scale(0.707)' xlink:href='%23MJMAIN-AF' x='-195' y='0'%3e%3c/use%3e%3c/g%3e%3cg transform='translate(304%2c0)'%3e%3cuse xlink:href='%23MJMAIN-78' x='0' y='0'%3e%3c/use%3e%3cuse transform='scale(0.707)' xlink:href='%23MJMAIN-32' x='747' y='-213'%3e%3c/use%3e%3c/g%3e%3cuse xlink:href='%23MJMAIN-3D' x='1564' y='0'%3e%3c/use%3e%3cg transform='translate(2343%2c0)'%3e%3cg transform='translate(397%2c0)'%3e%3crect stroke='none' width='834' height='60' x='0' y='220'%3e%3c/rect%3e%3cuse transform='scale(0.707)' xlink:href='%23MJMAIN-31' x='339' y='602'%3e%3c/use%3e%3cg transform='translate(60%2c-345)'%3e%3cuse transform='scale(0.707)' xlink:href='%23MJMAIN-6E' x='0' y='0'%3e%3c/use%3e%3cuse transform='scale(0.5)' xlink:href='%23MJMAIN-32' x='787' y='-213'%3e%3c/use%3e%3c/g%3e%3c/g%3e%3c/g%3e%3cg transform='translate(3862%2c0)'%3e%3cuse xlink:href='%23MJSZ1-2211' x='0' y='0'%3e%3c/use%3e%3cg transform='translate(1056%2c477)'%3e%3cuse transform='scale(0.707)' xlink:href='%23MJMAIN-6E' x='0' y='0'%3e%3c/use%3e%3cuse transform='scale(0.5)' xlink:href='%23MJMAIN-32' x='787' y='-213'%3e%3c/use%3e%3c/g%3e%3cg transform='translate(1056%2c-287)'%3e%3cuse transform='scale(0.707)' xlink:href='%23MJMAIN-69' x='0' y='0'%3e%3c/use%3e%3cuse transform='scale(0.707)' xlink:href='%23MJMAIN-3D' x='278' y='0'%3e%3c/use%3e%3cuse transform='scale(0.707)' xlink:href='%23MJMAIN-31' x='1057' y='0'%3e%3c/use%3e%3c/g%3e%3c/g%3e%3c/g%3e%3c/g%3e%3c/g%3e%3c/g%3e%3c/svg%3e)
2. Calculate the unpooled sample variances
'%3e%3cg transform='translate(167%2c0)'%3e%3cg transform='translate(-13%2c0)'%3e%3cg transform='translate(0%2c52)'%3e%3cuse xlink:href='%23MJMAIN-73' x='0' y='0'%3e%3c/use%3e%3cuse transform='scale(0.707)' xlink:href='%23MJMAIN-32' x='557' y='488'%3e%3c/use%3e%3cuse transform='scale(0.707)' xlink:href='%23MJMAIN-31' x='557' y='-435'%3e%3c/use%3e%3cuse xlink:href='%23MJMAIN-3D' x='1126' y='0'%3e%3c/use%3e%3cg transform='translate(1904%2c0)'%3e%3cg transform='translate(397%2c0)'%3e%3crect stroke='none' width='1738' height='60' x='0' y='220'%3e%3c/rect%3e%3cuse transform='scale(0.707)' xlink:href='%23MJMAIN-31' x='979' y='602'%3e%3c/use%3e%3cg transform='translate(60%2c-397)'%3e%3cuse transform='scale(0.707)' xlink:href='%23MJMAIN-6E' x='0' y='0'%3e%3c/use%3e%3cuse transform='scale(0.5)' xlink:href='%23MJMAIN-31' x='787' y='-213'%3e%3c/use%3e%3cuse transform='scale(0.707)' xlink:href='%23MJMAIN-2212' x='1010' y='0'%3e%3c/use%3e%3cuse transform='scale(0.707)' xlink:href='%23MJMAIN-31' x='1788' y='0'%3e%3c/use%3e%3c/g%3e%3c/g%3e%3c/g%3e%3cg transform='translate(4327%2c0)'%3e%3cuse xlink:href='%23MJSZ1-2211' x='0' y='0'%3e%3c/use%3e%3cg transform='translate(1056%2c477)'%3e%3cuse transform='scale(0.707)' xlink:href='%23MJMAIN-6E' x='0' y='0'%3e%3c/use%3e%3cuse transform='scale(0.5)' xlink:href='%23MJMAIN-31' x='787' y='-213'%3e%3c/use%3e%3c/g%3e%3cg transform='translate(1056%2c-287)'%3e%3cuse transform='scale(0.707)' xlink:href='%23MJMAIN-69' x='0' y='0'%3e%3c/use%3e%3cuse transform='scale(0.707)' xlink:href='%23MJMAIN-3D' x='278' y='0'%3e%3c/use%3e%3cuse transform='scale(0.707)' xlink:href='%23MJMAIN-31' x='1057' y='0'%3e%3c/use%3e%3c/g%3e%3c/g%3e%3cuse xlink:href='%23MJMAIN-28' x='6585' y='0'%3e%3c/use%3e%3cg transform='translate(6975%2c0)'%3e%3cuse xlink:href='%23MJMAIN-78' x='0' y='0'%3e%3c/use%3e%3cg transform='translate(528%2c-150)'%3e%3cuse transform='scale(0.707)' xlink:href='%23MJMAIN-31' x='0' y='0'%3e%3c/use%3e%3cuse transform='scale(0.707)' xlink:href='%23MJMAIN-69' x='500' y='0'%3e%3c/use%3e%3c/g%3e%3c/g%3e%3cuse xlink:href='%23MJMAIN-2212' x='8376' y='0'%3e%3c/use%3e%3cg transform='translate(9377%2c0)'%3e%3cg transform='translate(0%2c-184)'%3e%3cuse transform='scale(0.707)' xlink:href='%23MJMAIN-AF' x='-70' y='0'%3e%3c/use%3e%3cuse transform='scale(0.707)' xlink:href='%23MJMAIN-AF' x='-195' y='0'%3e%3c/use%3e%3c/g%3e%3c/g%3e%3cg transform='translate(9682%2c0)'%3e%3cuse xlink:href='%23MJMAIN-78' x='0' y='0'%3e%3c/use%3e%3cuse transform='scale(0.707)' xlink:href='%23MJMAIN-32' x='747' y='488'%3e%3c/use%3e%3cuse transform='scale(0.707)' xlink:href='%23MJMAIN-31' x='747' y='-435'%3e%3c/use%3e%3c/g%3e%3cuse xlink:href='%23MJMAIN-29' x='10664' y='0'%3e%3c/use%3e%3c/g%3e%3c/g%3e%3c/g%3e%3c/g%3e%3c/svg%3e)
'%3e%3cg transform='translate(167%2c0)'%3e%3cg transform='translate(-13%2c0)'%3e%3cg transform='translate(0%2c52)'%3e%3cuse xlink:href='%23MJMAIN-73' x='0' y='0'%3e%3c/use%3e%3cuse transform='scale(0.707)' xlink:href='%23MJMAIN-32' x='557' y='488'%3e%3c/use%3e%3cuse transform='scale(0.707)' xlink:href='%23MJMAIN-32' x='557' y='-435'%3e%3c/use%3e%3cuse xlink:href='%23MJMAIN-3D' x='1126' y='0'%3e%3c/use%3e%3cg transform='translate(1904%2c0)'%3e%3cg transform='translate(397%2c0)'%3e%3crect stroke='none' width='1738' height='60' x='0' y='220'%3e%3c/rect%3e%3cuse transform='scale(0.707)' xlink:href='%23MJMAIN-31' x='979' y='602'%3e%3c/use%3e%3cg transform='translate(60%2c-397)'%3e%3cuse transform='scale(0.707)' xlink:href='%23MJMAIN-6E' x='0' y='0'%3e%3c/use%3e%3cuse transform='scale(0.5)' xlink:href='%23MJMAIN-32' x='787' y='-213'%3e%3c/use%3e%3cuse transform='scale(0.707)' xlink:href='%23MJMAIN-2212' x='1010' y='0'%3e%3c/use%3e%3cuse transform='scale(0.707)' xlink:href='%23MJMAIN-31' x='1788' y='0'%3e%3c/use%3e%3c/g%3e%3c/g%3e%3c/g%3e%3cg transform='translate(4327%2c0)'%3e%3cuse xlink:href='%23MJSZ1-2211' x='0' y='0'%3e%3c/use%3e%3cg transform='translate(1056%2c477)'%3e%3cuse transform='scale(0.707)' xlink:href='%23MJMAIN-6E' x='0' y='0'%3e%3c/use%3e%3cuse transform='scale(0.5)' xlink:href='%23MJMAIN-32' x='787' y='-213'%3e%3c/use%3e%3c/g%3e%3cg transform='translate(1056%2c-287)'%3e%3cuse transform='scale(0.707)' xlink:href='%23MJMAIN-69' x='0' y='0'%3e%3c/use%3e%3cuse transform='scale(0.707)' xlink:href='%23MJMAIN-3D' x='278' y='0'%3e%3c/use%3e%3cuse transform='scale(0.707)' xlink:href='%23MJMAIN-31' x='1057' y='0'%3e%3c/use%3e%3c/g%3e%3c/g%3e%3cuse xlink:href='%23MJMAIN-28' x='6585' y='0'%3e%3c/use%3e%3cg transform='translate(6975%2c0)'%3e%3cuse xlink:href='%23MJMAIN-78' x='0' y='0'%3e%3c/use%3e%3cg transform='translate(528%2c-150)'%3e%3cuse transform='scale(0.707)' xlink:href='%23MJMAIN-32' x='0' y='0'%3e%3c/use%3e%3cuse transform='scale(0.707)' xlink:href='%23MJMAIN-69' x='500' y='0'%3e%3c/use%3e%3c/g%3e%3c/g%3e%3cuse xlink:href='%23MJMAIN-2212' x='8376' y='0'%3e%3c/use%3e%3cg transform='translate(9377%2c0)'%3e%3cg transform='translate(0%2c-184)'%3e%3cuse transform='scale(0.707)' xlink:href='%23MJMAIN-AF' x='-70' y='0'%3e%3c/use%3e%3cuse transform='scale(0.707)' xlink:href='%23MJMAIN-AF' x='-195' y='0'%3e%3c/use%3e%3c/g%3e%3c/g%3e%3cg transform='translate(9682%2c0)'%3e%3cuse xlink:href='%23MJMAIN-78' x='0' y='0'%3e%3c/use%3e%3cuse transform='scale(0.707)' xlink:href='%23MJMAIN-32' x='747' y='488'%3e%3c/use%3e%3cuse transform='scale(0.707)' xlink:href='%23MJMAIN-32' x='747' y='-435'%3e%3c/use%3e%3c/g%3e%3cuse xlink:href='%23MJMAIN-29' x='10664' y='0'%3e%3c/use%3e%3c/g%3e%3c/g%3e%3c/g%3e%3c/g%3e%3c/svg%3e)
'%3e%3cg transform='translate(167%2c0)'%3e%3cg transform='translate(-13%2c0)'%3e%3cg transform='translate(0%2c-50)'%3e%3cuse xlink:href='%23MJMAIN-6E' x='0' y='0'%3e%3c/use%3e%3cuse transform='scale(0.707)' xlink:href='%23MJMAIN-31' x='787' y='-213'%3e%3c/use%3e%3cuse xlink:href='%23MJMAIN-2212' x='1232' y='0'%3e%3c/use%3e%3cuse xlink:href='%23MJMAIN-31' x='2233' y='0'%3e%3c/use%3e%3c/g%3e%3c/g%3e%3c/g%3e%3c/g%3e%3c/svg%3e) are the degrees of freedom for
are the degrees of freedom for
'%3e%3cg transform='translate(167%2c0)'%3e%3cg transform='translate(-13%2c0)'%3e%3cg transform='translate(0%2c-50)'%3e%3cuse xlink:href='%23MJMAIN-47' x='0' y='0'%3e%3c/use%3e%3cuse transform='scale(0.707)' xlink:href='%23MJMAIN-31' x='1110' y='-213'%3e%3c/use%3e%3c/g%3e%3c/g%3e%3c/g%3e%3c/g%3e%3c/svg%3e)
'%3e%3cg transform='translate(167%2c0)'%3e%3cg transform='translate(-13%2c0)'%3e%3cg transform='translate(0%2c-50)'%3e%3cuse xlink:href='%23MJMAIN-6E' x='0' y='0'%3e%3c/use%3e%3cuse transform='scale(0.707)' xlink:href='%23MJMAIN-32' x='787' y='-213'%3e%3c/use%3e%3cuse xlink:href='%23MJMAIN-2212' x='1232' y='0'%3e%3c/use%3e%3cuse xlink:href='%23MJMAIN-31' x='2233' y='0'%3e%3c/use%3e%3c/g%3e%3c/g%3e%3c/g%3e%3c/g%3e%3c/svg%3e) are the degrees of freedom for
are the degrees of freedom for
'%3e%3cg transform='translate(167%2c0)'%3e%3cg transform='translate(-13%2c0)'%3e%3cg transform='translate(0%2c-50)'%3e%3cuse xlink:href='%23MJMAIN-47' x='0' y='0'%3e%3c/use%3e%3cuse transform='scale(0.707)' xlink:href='%23MJMAIN-32' x='1110' y='-213'%3e%3c/use%3e%3c/g%3e%3c/g%3e%3c/g%3e%3c/g%3e%3c/svg%3e)
3. Calculate the pooled sample variances
In the pooled approach only - not used in DataTile
'%3e%3cg transform='translate(167%2c0)'%3e%3cg transform='translate(-13%2c0)'%3e%3cg transform='translate(0%2c-141)'%3e%3cuse xlink:href='%23MJMATHI-73' x='0' y='0'%3e%3c/use%3e%3cuse transform='scale(0.707)' xlink:href='%23MJMAIN-32' x='663' y='488'%3e%3c/use%3e%3cuse transform='scale(0.707)' xlink:href='%23MJMATHI-70' x='663' y='-212'%3e%3c/use%3e%3cuse xlink:href='%23MJMAIN-3D' x='1203' y='0'%3e%3c/use%3e%3cg transform='translate(1981%2c0)'%3e%3cg transform='translate(397%2c0)'%3e%3crect stroke='none' width='10303' height='60' x='0' y='220'%3e%3c/rect%3e%3cg transform='translate(60%2c801)'%3e%3cuse xlink:href='%23MJMAIN-28' x='0' y='0'%3e%3c/use%3e%3cg transform='translate(389%2c0)'%3e%3cuse xlink:href='%23MJMATHI-6E' x='0' y='0'%3e%3c/use%3e%3cuse transform='scale(0.707)' xlink:href='%23MJMAIN-31' x='849' y='-213'%3e%3c/use%3e%3c/g%3e%3cuse xlink:href='%23MJMAIN-2212' x='1666' y='0'%3e%3c/use%3e%3cuse xlink:href='%23MJMAIN-31' x='2666' y='0'%3e%3c/use%3e%3cuse xlink:href='%23MJMAIN-29' x='3167' y='0'%3e%3c/use%3e%3cg transform='translate(3556%2c0)'%3e%3cuse xlink:href='%23MJMATHI-73' x='0' y='0'%3e%3c/use%3e%3cuse transform='scale(0.707)' xlink:href='%23MJMAIN-32' x='663' y='488'%3e%3c/use%3e%3cuse transform='scale(0.707)' xlink:href='%23MJMAIN-31' x='663' y='-435'%3e%3c/use%3e%3c/g%3e%3cuse xlink:href='%23MJMAIN-2B' x='4702' y='0'%3e%3c/use%3e%3cuse xlink:href='%23MJMAIN-28' x='5703' y='0'%3e%3c/use%3e%3cg transform='translate(6092%2c0)'%3e%3cuse xlink:href='%23MJMATHI-6E' x='0' y='0'%3e%3c/use%3e%3cuse transform='scale(0.707)' xlink:href='%23MJMAIN-32' x='849' y='-213'%3e%3c/use%3e%3c/g%3e%3cuse xlink:href='%23MJMAIN-2212' x='7369' y='0'%3e%3c/use%3e%3cuse xlink:href='%23MJMAIN-31' x='8370' y='0'%3e%3c/use%3e%3cuse xlink:href='%23MJMAIN-29' x='8870' y='0'%3e%3c/use%3e%3cg transform='translate(9260%2c0)'%3e%3cuse xlink:href='%23MJMATHI-73' x='0' y='0'%3e%3c/use%3e%3cuse transform='scale(0.707)' xlink:href='%23MJMAIN-32' x='663' y='488'%3e%3c/use%3e%3cuse transform='scale(0.707)' xlink:href='%23MJMAIN-32' x='663' y='-435'%3e%3c/use%3e%3c/g%3e%3c/g%3e%3cg transform='translate(2624%2c-686)'%3e%3cuse xlink:href='%23MJMATHI-6E' x='0' y='0'%3e%3c/use%3e%3cuse transform='scale(0.707)' xlink:href='%23MJMAIN-31' x='849' y='-213'%3e%3c/use%3e%3cuse xlink:href='%23MJMAIN-2B' x='1276' y='0'%3e%3c/use%3e%3cg transform='translate(2277%2c0)'%3e%3cuse xlink:href='%23MJMATHI-6E' x='0' y='0'%3e%3c/use%3e%3cuse transform='scale(0.707)' xlink:href='%23MJMAIN-32' x='849' y='-213'%3e%3c/use%3e%3c/g%3e%3cuse xlink:href='%23MJMAIN-2212' x='3553' y='0'%3e%3c/use%3e%3cuse xlink:href='%23MJMAIN-32' x='4554' y='0'%3e%3c/use%3e%3c/g%3e%3c/g%3e%3c/g%3e%3c/g%3e%3c/g%3e%3c/g%3e%3c/g%3e%3c/svg%3e)
4. Calculate the Standard Error
Pooled variance - not used in DataTile
'%3e%3cg transform='translate(167%2c0)'%3e%3cg transform='translate(-13%2c0)'%3e%3cg transform='translate(0%2c-148)'%3e%3cuse xlink:href='%23MJMATHI-53' x='0' y='0'%3e%3c/use%3e%3cg transform='translate(645%2c0)'%3e%3cuse xlink:href='%23MJMATHI-45' x='0' y='0'%3e%3c/use%3e%3cuse transform='scale(0.707)' xlink:href='%23MJMATHI-70' x='1044' y='-213'%3e%3c/use%3e%3c/g%3e%3cuse xlink:href='%23MJMAIN-3D' x='2117' y='0'%3e%3c/use%3e%3cg transform='translate(3174%2c0)'%3e%3cuse xlink:href='%23MJSZ3-221A' x='0' y='120'%3e%3c/use%3e%3crect stroke='none' width='5756' height='60' x='1000' y='1511'%3e%3c/rect%3e%3cg transform='translate(1000%2c0)'%3e%3cuse xlink:href='%23MJMATHI-73' x='0' y='0'%3e%3c/use%3e%3cuse transform='scale(0.707)' xlink:href='%23MJMAIN-32' x='663' y='488'%3e%3c/use%3e%3cuse transform='scale(0.707)' xlink:href='%23MJMATHI-70' x='663' y='-212'%3e%3c/use%3e%3cuse xlink:href='%23MJMAIN-28' x='925' y='0'%3e%3c/use%3e%3cg transform='translate(1315%2c0)'%3e%3cg transform='translate(120%2c0)'%3e%3crect stroke='none' width='1174' height='60' x='0' y='220'%3e%3c/rect%3e%3cuse xlink:href='%23MJMAIN-31' x='336' y='676'%3e%3c/use%3e%3cg transform='translate(60%2c-686)'%3e%3cuse xlink:href='%23MJMATHI-6E' x='0' y='0'%3e%3c/use%3e%3cuse transform='scale(0.707)' xlink:href='%23MJMAIN-31' x='849' y='-213'%3e%3c/use%3e%3c/g%3e%3c/g%3e%3c/g%3e%3cuse xlink:href='%23MJMAIN-2B' x='2951' y='0'%3e%3c/use%3e%3cg transform='translate(3730%2c0)'%3e%3cg transform='translate(342%2c0)'%3e%3crect stroke='none' width='1174' height='60' x='0' y='220'%3e%3c/rect%3e%3cuse xlink:href='%23MJMAIN-31' x='336' y='676'%3e%3c/use%3e%3cg transform='translate(60%2c-686)'%3e%3cuse xlink:href='%23MJMATHI-6E' x='0' y='0'%3e%3c/use%3e%3cuse transform='scale(0.707)' xlink:href='%23MJMAIN-32' x='849' y='-213'%3e%3c/use%3e%3c/g%3e%3c/g%3e%3c/g%3e%3cuse xlink:href='%23MJMAIN-29' x='5366' y='0'%3e%3c/use%3e%3c/g%3e%3c/g%3e%3c/g%3e%3c/g%3e%3c/g%3e%3c/g%3e%3c/svg%3e)
Unpooled variance - used in DataTile
'%3e%3cg transform='translate(167%2c0)'%3e%3cg transform='translate(-13%2c0)'%3e%3cg transform='translate(0%2c-148)'%3e%3cuse xlink:href='%23MJMATHI-53' x='0' y='0'%3e%3c/use%3e%3cg transform='translate(645%2c0)'%3e%3cuse xlink:href='%23MJMATHI-45' x='0' y='0'%3e%3c/use%3e%3cuse transform='scale(0.707)' xlink:href='%23MJMATHI-75' x='1044' y='-213'%3e%3c/use%3e%3c/g%3e%3cuse xlink:href='%23MJMAIN-3D' x='2166' y='0'%3e%3c/use%3e%3cg transform='translate(3222%2c0)'%3e%3cuse xlink:href='%23MJSZ4-221A' x='0' y='117'%3e%3c/use%3e%3crect stroke='none' width='4051' height='60' x='1000' y='1808'%3e%3c/rect%3e%3cg transform='translate(1000%2c0)'%3e%3cg transform='translate(120%2c0)'%3e%3crect stroke='none' width='1174' height='60' x='0' y='220'%3e%3c/rect%3e%3cg transform='translate(125%2c801)'%3e%3cuse xlink:href='%23MJMATHI-73' x='0' y='0'%3e%3c/use%3e%3cuse transform='scale(0.707)' xlink:href='%23MJMAIN-32' x='663' y='488'%3e%3c/use%3e%3cuse transform='scale(0.707)' xlink:href='%23MJMAIN-31' x='663' y='-435'%3e%3c/use%3e%3c/g%3e%3cg transform='translate(60%2c-686)'%3e%3cuse xlink:href='%23MJMATHI-6E' x='0' y='0'%3e%3c/use%3e%3cuse transform='scale(0.707)' xlink:href='%23MJMAIN-31' x='849' y='-213'%3e%3c/use%3e%3c/g%3e%3c/g%3e%3cuse xlink:href='%23MJMAIN-2B' x='1636' y='0'%3e%3c/use%3e%3cg transform='translate(2415%2c0)'%3e%3cg transform='translate(342%2c0)'%3e%3crect stroke='none' width='1174' height='60' x='0' y='220'%3e%3c/rect%3e%3cg transform='translate(125%2c801)'%3e%3cuse xlink:href='%23MJMATHI-73' x='0' y='0'%3e%3c/use%3e%3cuse transform='scale(0.707)' xlink:href='%23MJMAIN-32' x='663' y='488'%3e%3c/use%3e%3cuse transform='scale(0.707)' xlink:href='%23MJMAIN-32' x='663' y='-435'%3e%3c/use%3e%3c/g%3e%3cg transform='translate(60%2c-686)'%3e%3cuse xlink:href='%23MJMATHI-6E' x='0' y='0'%3e%3c/use%3e%3cuse transform='scale(0.707)' xlink:href='%23MJMAIN-32' x='849' y='-213'%3e%3c/use%3e%3c/g%3e%3c/g%3e%3c/g%3e%3c/g%3e%3c/g%3e%3c/g%3e%3c/g%3e%3c/g%3e%3c/g%3e%3c/svg%3e)
5. Compute the T-Score
Pooled variance - not used in DataTile
'%3e%3cg transform='translate(167%2c0)'%3e%3cg transform='translate(-13%2c0)'%3e%3cg transform='translate(0%2c17)'%3e%3cuse xlink:href='%23MJMATHI-74' x='0' y='0'%3e%3c/use%3e%3cuse xlink:href='%23MJMAIN-3D' x='639' y='0'%3e%3c/use%3e%3cg transform='translate(1417%2c0)'%3e%3cg transform='translate(397%2c0)'%3e%3crect stroke='none' width='3494' height='60' x='0' y='220'%3e%3c/rect%3e%3cg transform='translate(60%2c676)'%3e%3cuse xlink:href='%23MJMATHI-78' x='24' y='0'%3e%3c/use%3e%3cg transform='translate(0%2c259)'%3e%3cuse transform='scale(0.707)' xlink:href='%23MJMAIN-AF' x='-70' y='0'%3e%3c/use%3e%3cg transform='translate(243.33524654895245%2c0) scale(0.2427625054254761%2c1)'%3e%3cuse transform='scale(0.707)' xlink:href='%23MJMAIN-AF'%3e%3c/use%3e%3c/g%3e%3cuse transform='scale(0.707)' xlink:href='%23MJMAIN-AF' x='379' y='0'%3e%3c/use%3e%3c/g%3e%3cuse transform='scale(0.707)' xlink:href='%23MJMAIN-31' x='879' y='-213'%3e%3c/use%3e%3cuse xlink:href='%23MJMAIN-2212' x='1298' y='0'%3e%3c/use%3e%3cg transform='translate(2298%2c0)'%3e%3cuse xlink:href='%23MJMATHI-78' x='24' y='0'%3e%3c/use%3e%3cg transform='translate(0%2c259)'%3e%3cuse transform='scale(0.707)' xlink:href='%23MJMAIN-AF' x='-70' y='0'%3e%3c/use%3e%3cg transform='translate(243.33524654895245%2c0) scale(0.2427625054254761%2c1)'%3e%3cuse transform='scale(0.707)' xlink:href='%23MJMAIN-AF'%3e%3c/use%3e%3c/g%3e%3cuse transform='scale(0.707)' xlink:href='%23MJMAIN-AF' x='379' y='0'%3e%3c/use%3e%3c/g%3e%3cuse transform='scale(0.707)' xlink:href='%23MJMAIN-32' x='879' y='-213'%3e%3c/use%3e%3c/g%3e%3c/g%3e%3cg transform='translate(827%2c-700)'%3e%3cuse xlink:href='%23MJMATHI-53' x='0' y='0'%3e%3c/use%3e%3cg transform='translate(645%2c0)'%3e%3cuse xlink:href='%23MJMATHI-45' x='0' y='0'%3e%3c/use%3e%3cuse transform='scale(0.707)' xlink:href='%23MJMATHI-70' x='1044' y='-213'%3e%3c/use%3e%3c/g%3e%3c/g%3e%3c/g%3e%3c/g%3e%3c/g%3e%3c/g%3e%3c/g%3e%3c/g%3e%3c/svg%3e)
Unpooled variance - used in DataTile
'%3e%3cg transform='translate(167%2c0)'%3e%3cg transform='translate(-13%2c0)'%3e%3cg transform='translate(0%2c-48)'%3e%3cuse xlink:href='%23MJMATHI-74' x='0' y='0'%3e%3c/use%3e%3cuse xlink:href='%23MJMAIN-3D' x='639' y='0'%3e%3c/use%3e%3cg transform='translate(1417%2c0)'%3e%3cg transform='translate(397%2c0)'%3e%3crect stroke='none' width='3494' height='60' x='0' y='220'%3e%3c/rect%3e%3cg transform='translate(60%2c676)'%3e%3cuse xlink:href='%23MJMATHI-78' x='24' y='0'%3e%3c/use%3e%3cg transform='translate(0%2c259)'%3e%3cuse transform='scale(0.707)' xlink:href='%23MJMAIN-AF' x='-70' y='0'%3e%3c/use%3e%3cg transform='translate(243.33524654895245%2c0) scale(0.2427625054254761%2c1)'%3e%3cuse transform='scale(0.707)' xlink:href='%23MJMAIN-AF'%3e%3c/use%3e%3c/g%3e%3cuse transform='scale(0.707)' xlink:href='%23MJMAIN-AF' x='379' y='0'%3e%3c/use%3e%3c/g%3e%3cuse transform='scale(0.707)' xlink:href='%23MJMAIN-31' x='879' y='-213'%3e%3c/use%3e%3cuse xlink:href='%23MJMAIN-2212' x='1298' y='0'%3e%3c/use%3e%3cg transform='translate(2298%2c0)'%3e%3cuse xlink:href='%23MJMATHI-78' x='24' y='0'%3e%3c/use%3e%3cg transform='translate(0%2c259)'%3e%3cuse transform='scale(0.707)' xlink:href='%23MJMAIN-AF' x='-70' y='0'%3e%3c/use%3e%3cg transform='translate(243.33524654895245%2c0) scale(0.2427625054254761%2c1)'%3e%3cuse transform='scale(0.707)' xlink:href='%23MJMAIN-AF'%3e%3c/use%3e%3c/g%3e%3cuse transform='scale(0.707)' xlink:href='%23MJMAIN-AF' x='379' y='0'%3e%3c/use%3e%3c/g%3e%3cuse transform='scale(0.707)' xlink:href='%23MJMAIN-32' x='879' y='-213'%3e%3c/use%3e%3c/g%3e%3c/g%3e%3cg transform='translate(802%2c-700)'%3e%3cuse xlink:href='%23MJMATHI-53' x='0' y='0'%3e%3c/use%3e%3cg transform='translate(645%2c0)'%3e%3cuse xlink:href='%23MJMATHI-45' x='0' y='0'%3e%3c/use%3e%3cuse transform='scale(0.707)' xlink:href='%23MJMATHI-75' x='1044' y='-213'%3e%3c/use%3e%3c/g%3e%3c/g%3e%3c/g%3e%3c/g%3e%3c/g%3e%3c/g%3e%3c/g%3e%3c/g%3e%3c/svg%3e)
6. Z-approximation of the t-test
In classical statistics, the t-test uses the t-distribution, which incorporates degrees of freedom to account for sample size and variability. In many practical cases, especially in marketing research with large samples, the t-test is approximated using a Z-formula, without computing degrees of freedom explicitly. This method uses the same formula structure as the t-test, but interprets the result using the standard normal curve.
The theoretical foundation for this approach is the central limit theorem: as the sample size increases (and thus the degrees of freedom), the t-distribution gradually approaches the standard normal (Z) distribution
The chart below illustrates this convergence:
-
With df = 1, the t-distribution has heavy tails and a lower peak.
-
As degrees of freedom increase (e.g. df = 5, 10), the distribution narrows and becomes more symmetric.
-
By df = 30 or more, the t-distribution is nearly indistinguishable from the standard normal.
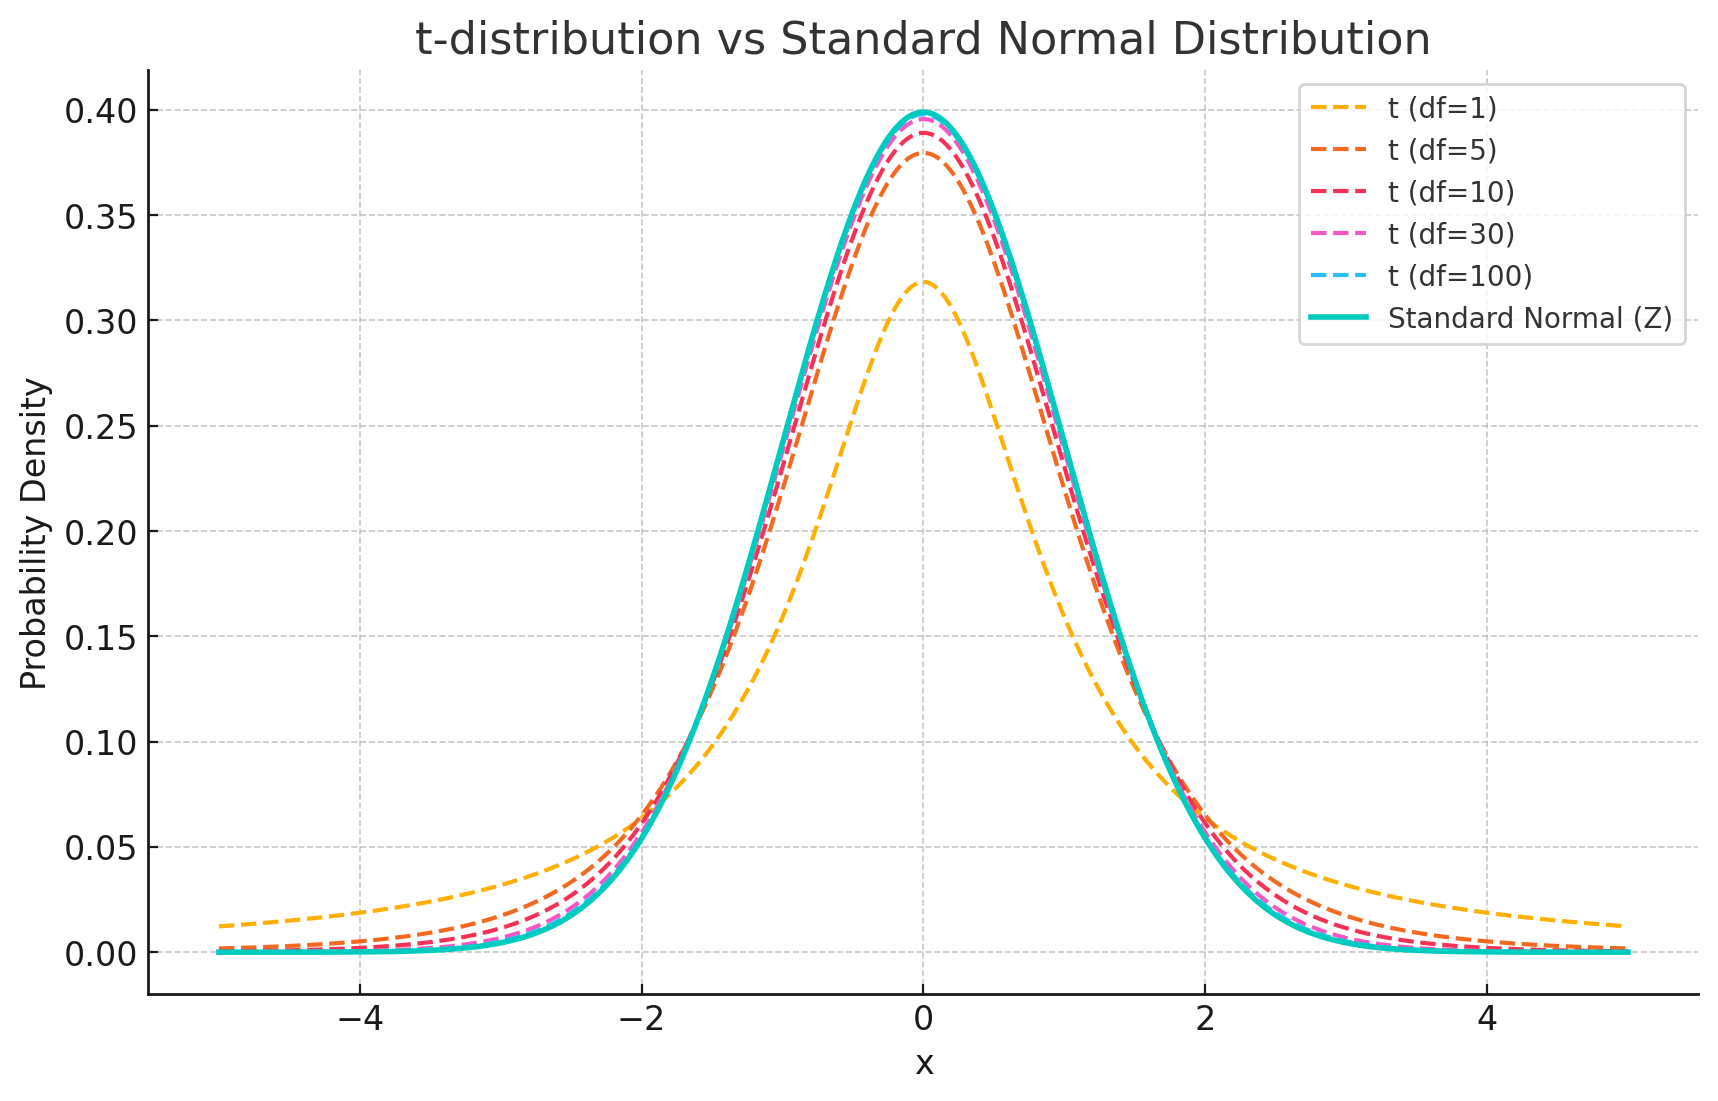
In DataTile, we apply a Z-approximation of Welch’s t-test, based on the assumption that with 30+ observations per group, the t-distribution closely aligns with the standard normal.
7. Determine Significance
Compare the T-score to the standard normal distribution to obtain the p-value. If the p-value is below the chosen significance level (typically 0.05), the difference in proportions is considered statistically significant, meaning it is unlikely to have occurred by random chance alone.