
The March release introduces several powerful improvements across analysis, visualization, and usability. The headline feature is the addition of TURF analysis. Other highlights include enhanced sorting options, improved handling of weights in controls, and new formulas, metrics, and chart updates that further boost analytical capabilities and streamline the user experience.
-
TURF analysis.
-
Flexible pattern-based autocompletion for MR-sets.
-
Preserving the initial sorting for crosstabs.
-
Sorting in ascending and descending order with the control.
-
Enhanced support for multiple weights in controls.
-
Abbreviation in number charts.
-
Grid Charts Enhancements.
-
Updated base calculation for Moving Deviation and Moving Average.
-
New MATH formulas: INDEX_U and INDEX_F.
-
New Metric: CpCb - Count per Capita base.
TURF Analysis
The TURF (Total Unduplicated Reach and Frequency) analysis feature is now available for users with the ‘Turf analysis’ role. Designed for marketing, media planning, and product research, TURF helps identify the optimal mix of options - like products or messages - that maximizes unique audience reach while minimizing overlap.
Here is an example of TURF calculation for channels of recruiting respondents for research participation:
.png?cb=daeb4d3c2789a2c60ad4ca99b4c36963)
Read a detailed article about TURF.
After the TURF charts are exported to dashboards, controls can be added to select TURF items, set pinned options, and apply filters to define the respondent base. This makes it easy to explore different audience scenarios dynamically, all within a familiar dashboard workflow.
Here is an example of handling the TURF analysis on a dashboard, where you can define the items, pin options, and filter using controls.
Source: Ofcom News Consumption Survey.
Flexible pattern-based autocompletion for MR-sets
For MR-sets, you can now enable or disable automatic addition by pattern at any time - not just during initial creation. However, note that the presence of a pattern is mandatory for this feature to function.
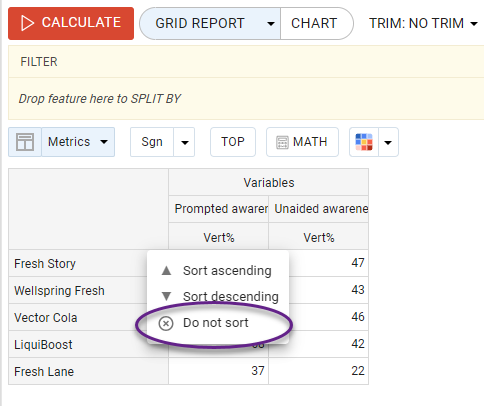
'Do not sort' as an initial order of categories
Enhanced functionality now allows users to reverse sorting in crosstabs effortlessly. An initial order of variables and categories in a crosstab is now preserved. When you cancel sorting by selecting the 'Do not sort' option, the list returns to its original state.
The same behavior applies to controls assigned as 'Sort by': choosing an option labeled, for example, as 'No sorting' will also restore the original order.
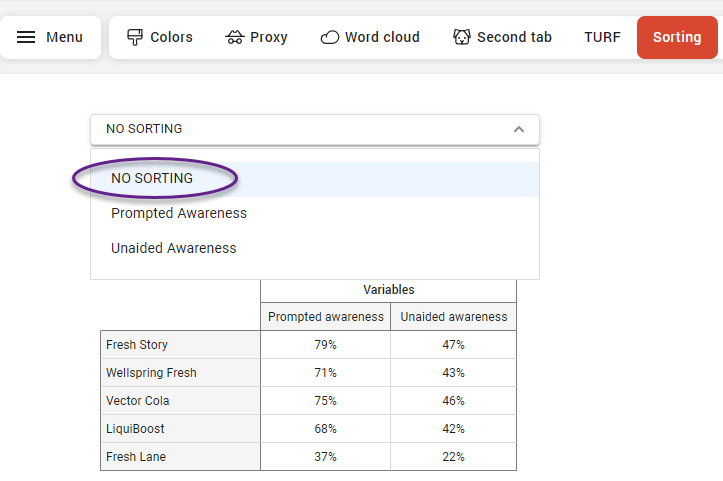
In general, any additional option with a name different from the ones being sorted will function the same way. However, we recommend using a clear and descriptive label to ensure better understanding and usability.
The ascending and descending order when sorting by the control
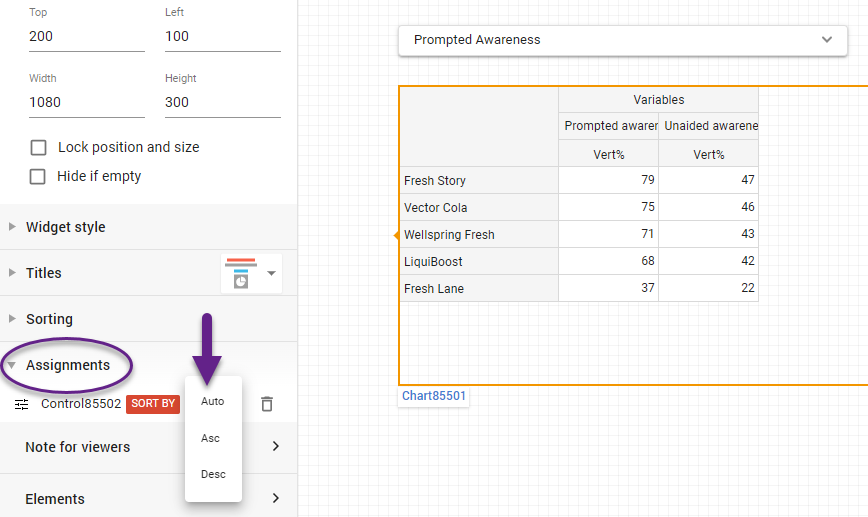
If you have a control assigned as 'Sort by', you can set the sort order as:
-
Asc – sorts the values from lowest to highest.
-
Desc – sorts the values from highest to lowest.
-
Auto – use the sorting applied in an x-tab.
To set the order, select the chart widget, go to the left menu pane → Assignments → Find the control assigned as ‘Sort by’. Click on the label next to the red ‘Sort by’ tag and select the sort order.
The selected sort order will be applied independently of any existing sort settings on the crosstab.
Enhanced support for multiple weights in controls
Full support is now available for multiple weights in controls with multiple selections (option groups).
Now, each group in the control applies the weight assigned specifically to it. However, when options are selected from different groups, the logic for weight application is as follows: the system uses the weight of the group from which the first selected option originates. This ensures consistent handling of mixed selections while respecting the assigned weight logic per group.
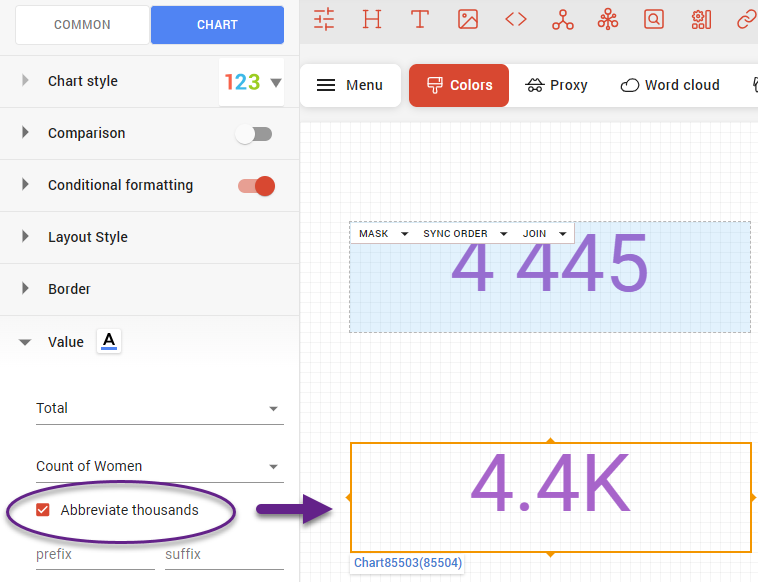
Abbreviation in number charts
Number charts can now be abbreviated for a cleaner and more visually appealing representation. Large values are automatically shortened (e.g., 1,200,000 becomes 1.2M), improving readability without sacrificing clarity.
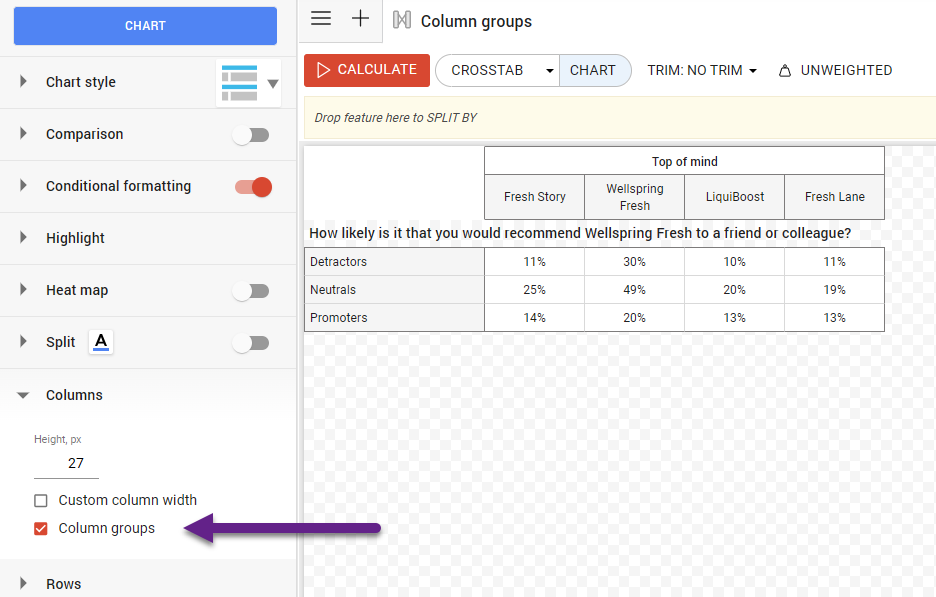
Grid Charts Enhancements
-
The preformatted grid chart now includes the option to add column group titles, allowing for more apparent organization and improved readability of grouped data.
-
Text wrapping is now supported for column group titles in grid charts, with a maximum of 2 lines for better readability and layout control.
-
Text wrapping is now also applied to hidden labels, allowing row heights to be consistent across side-by-side tables for a more aligned and visually balanced layout.
Selection to calculate the base for MA and MD
Previously, the base for moving average and moving deviation calculations was computed as a simple average. Now, the base is calculated using the selected MATH settings, allowing for more tailored and accurate computations based on your chosen method.
To select the method, go to the database settings → MATH → “Base calculated as' submenu.
New MATH formulas: INDEX_U and INDEX_F
When using cross-metric functions in Crosstab Math, the functions reference the value of a selected metric within a formula.
In addition to existing functions like VPT, HPT, CNT, and BASE, two new functions are now available:
-
INDEX_U – Inserts the value of the unfiltered Affinity index into the calculation.
-
INDEX_F – Inserts the value of the filtered Affinity index into the calculation.
These additions provide more convenience when creating custom formulas in crosstable analysis.
New Metric: CpC.B - Count per Capita Base
The Count per Capita (CpC) metric has been enhanced with the addition of Count per Capita Base (CpC.B). This improvement allows the metric to reflect the missing value policy applied during analysis.
While CpC is calculated as the ratio of total responses to Count, CpCb is calculated as the ratio of total responses to the Base. As a result, missing values are handled according to the policy defined for the base, offering a more accurate representation in cases where data completeness varies.