
TURF analysis, which stands for Total Unduplicated Reach and Frequency, is a statistical method used to identify the optimal combination of products, features, or marketing messages to maximise reach and frequency within a target audience. It helps businesses determine the best product mix to offer, even when resources are limited, by analysing how different combinations impact the number of unique individuals reached and how often they are reached.
Access to TURF is available only to users with the ‘Turf Analysis’ role.
To start TURF analysis
-
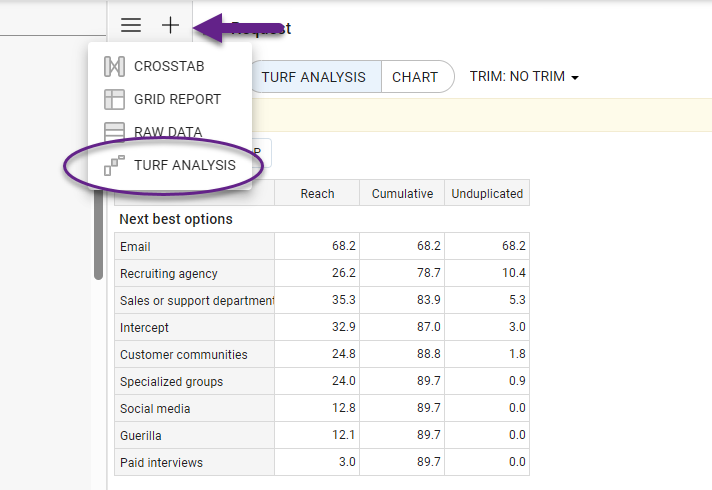
Create a new request tab and choose TURF ANALYSIS.
-
The table where the variable for calculation is placed includes, by default, three columns with metrics: Reach, Cumulative, and Unduplicated.
-
After the variable to be calculated is added, the calculation is performed automatically.
-
Switching to CHART mode, you get the visual representation of the three metrics.
.png?cb=94f0751b6a3a948d20b34e135ca43004)
TURF Settings
-
Pin to top: you can pin the options (e.g., a brands) you're most interested in as mandatory items in the calculation. The remaining options will then be displayed in descending order of their contribution, following the pinned one.
To pin the option, right-click on the option and select ‘Pin to Top’ in the menu that appears. You can pin as many options as you need.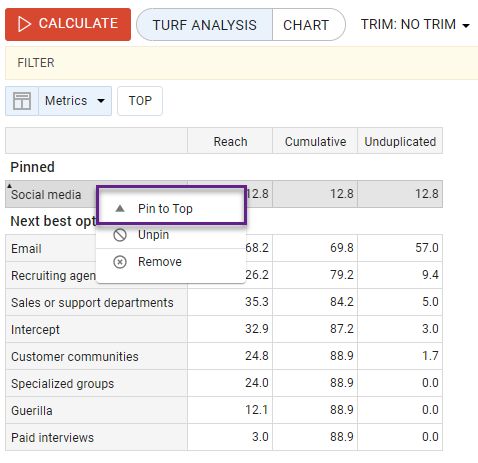
Here is what it looks like in CHART mode. The ‘Next best option’ label is added by default.
.png?cb=e9d93c9a282597578a53f8011325e9d9)
-
TOP options: if the number of options in a TURF analysis is large, it can be helpful to display only those that contribute meaningfully. Or you may want to display only 2 or 3 options that contribute the most.
Use the ‘Top’ feature above the table to set the desired number, and the chart will display only the most impactful options accordingly.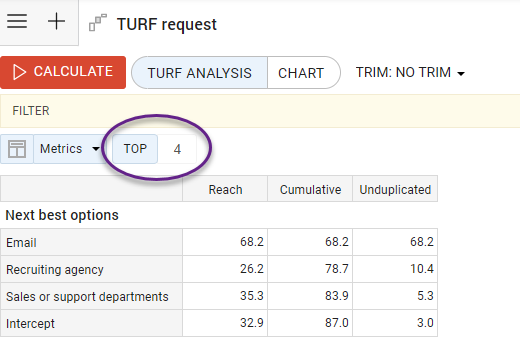
.png?cb=daeb4d3c2789a2c60ad4ca99b4c36963)
-
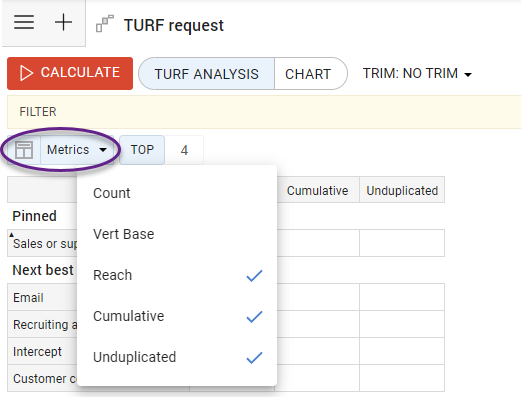
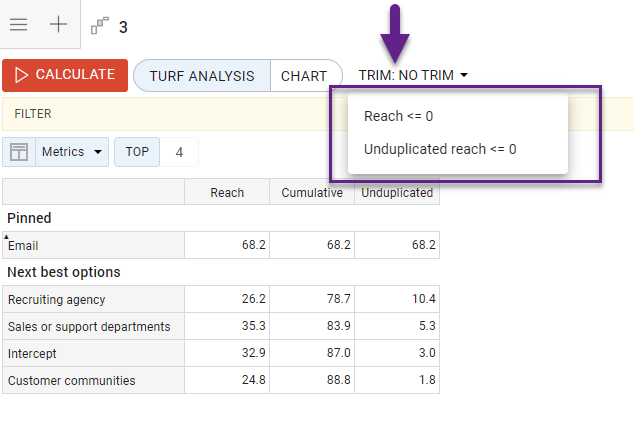
Metrics: by default, three metrics - Reach, Cumulative, and Unduplicated - are displayed, but you can add Count and Base, using the ‘Metrics’ button above the table. Also, you can switch off all unnecessary metrics.
-
TRIM: available custom trimming options to help you focus on the most impactful combinations. You can choose to:
-
Hide options that don’t contribute additional reach (Reach <=0);
-
Hide options that are fully duplicated by others in the set (Unduplicated reach <=0).
These settings make it easier to interpret results by excluding items that don’t improve overall reach.
-
TURF Chart Settings
-
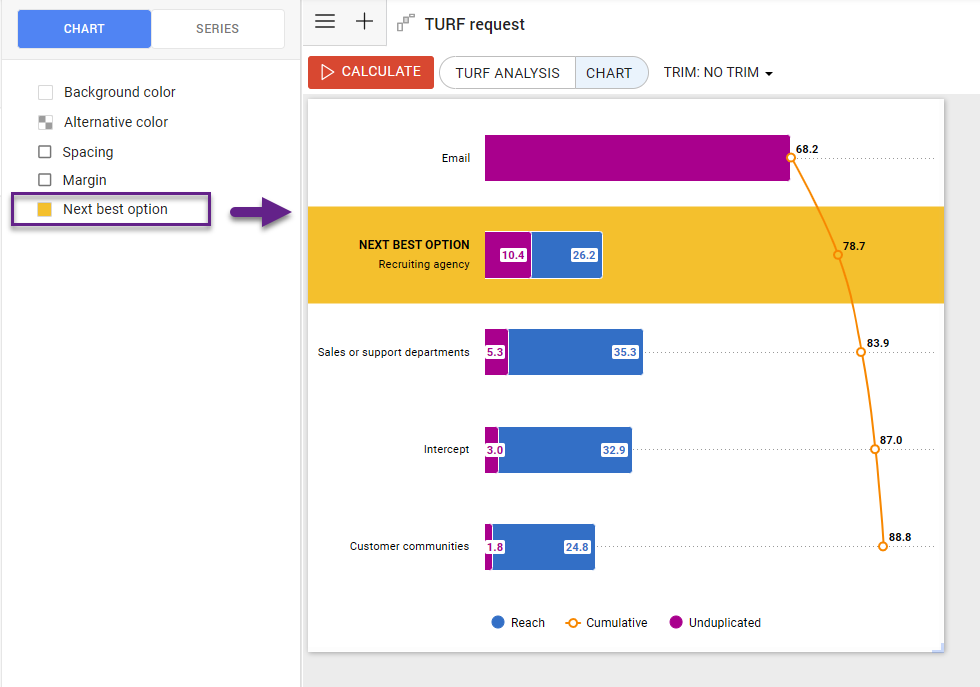
Chart tab: in this menu, you’ll find the usual options such as background and margins, along with a setting specific to the TURF chart — highlighting the ‘Next best option’ by color.
-
Series tab: here you can adjust the colors of series, and, unlike in the table, you can disable the visibility of metrics (series) by using the ‘eye’ icon.
TURF on Dashboard
After the TURF chart is exported to the dashboard, you can create controls and assign them to the widget as follows:
-
TURF ITEMS – to define which options will be included in the TURF analysis.
-
PIN – to specify which options are mandatory.
-
FILTER – to set the base or subset of respondents for the calculations.
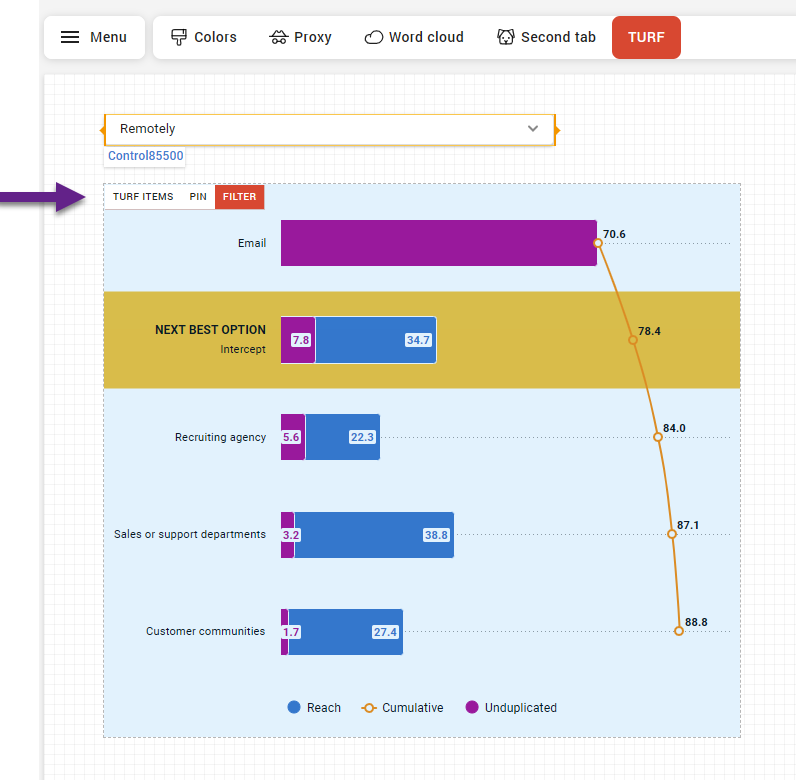
Here is an example of handling the TURF analysis on a dashboard, where you can define the items, pin options, and filter using controls.