
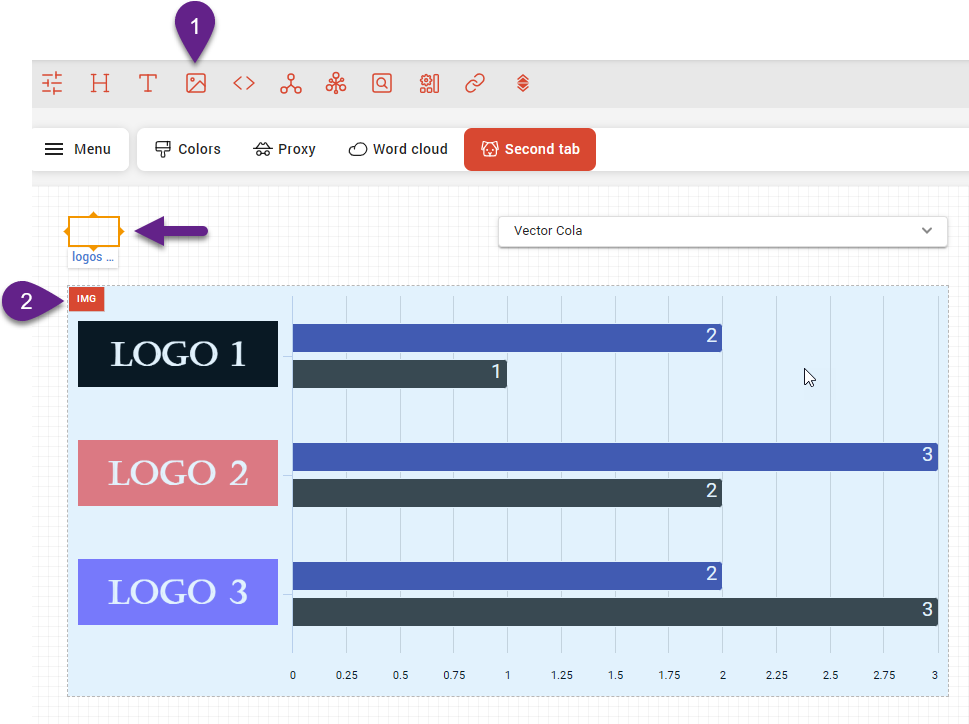
In DataTile, you can use images instead of text labels on the X-axis — commonly for branding purposes or to create a more visually appealing presentation.
To use images in a chart in DataTile, follow these steps:
-
Create an Image Bundle: click the ‘Create an image’ icon and upload your images. Make sure to tag all images appropriately. Tags must match the series labels in the chart (Read more about the tagging).
-
Assign to Chart: select the image widget and assign it to the chart using the ‘IMG’ assignment mode.
-
Select the chart and go to the left menu pane → Chart tab → X-axis → tick the ‘Image’ checkbox. Here you can adjust the image size.
Note that the checkbox ‘Labels’ must be ticked too.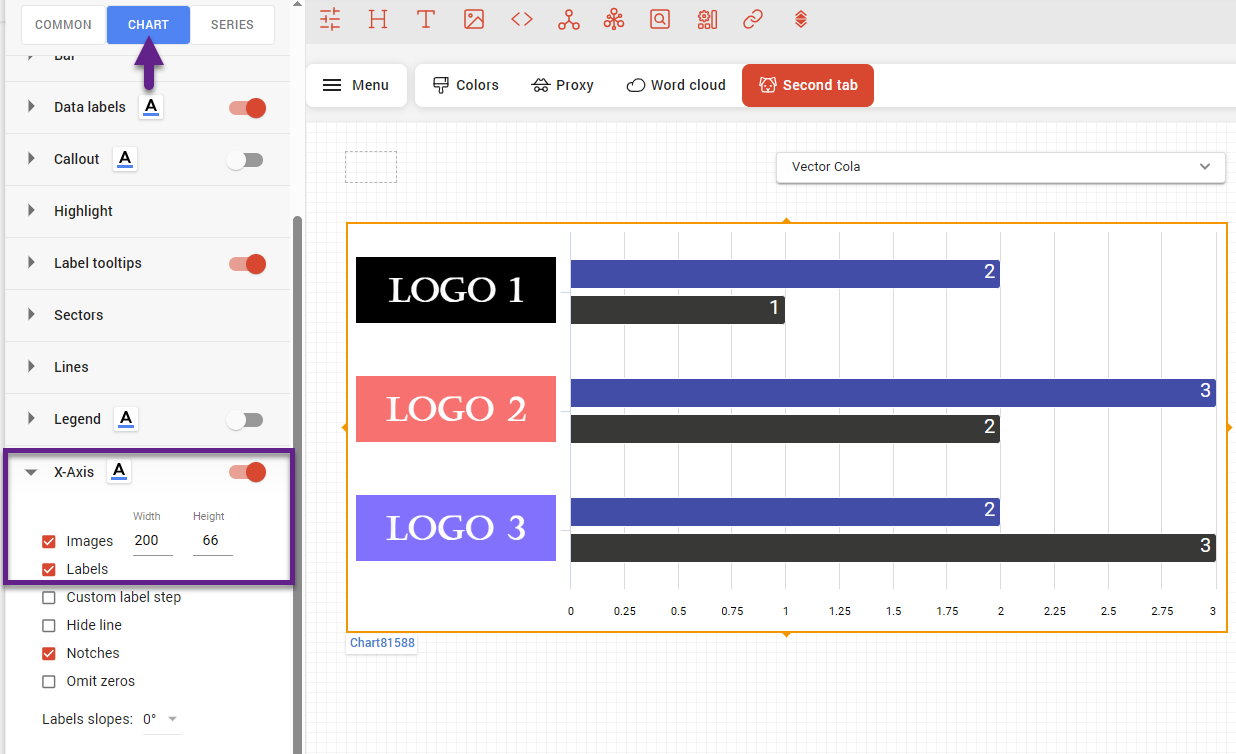
The system compares the tag with the series name and, if they match, displays the corresponding image instead of the label.