Standardized residuals are a powerful tool for brand profiling. This analysis highlights brands' typical and atypical attributes and provides insight into a brand's image within a competitive landscape.
Unlike absolute brand image analysis, standardized residuals provide a relative view by accounting for the "effect of large brands". Larger brands often receive more associations simply due to their high market presence. This method corrects for such biases, revealing a more accurate picture of brand positioning.
Methodology
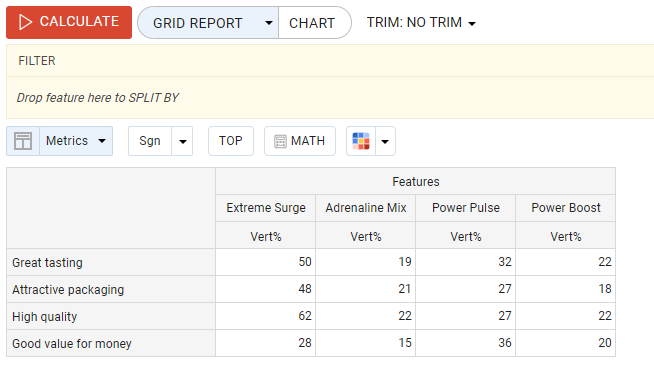
The analysis is based on a Grid Report table where:
-
Rows represent brand attributes;
-
Columns represent brands;
-
Cells contain the number of respondents who associate a particular brand with a given attribute.
A residual is the difference between the observed value (Y) and the expected value (X):
-
Observed value (Y): data collected from the study
-
Expected value (X): theoretical frequency assuming no association between brand and attribute, calculated as:

-
R = Row total (sum of all responses for an attribute);
-
C = Column total (sum of all responses for a brand);
-
N = Total number of responses in the table.
Standardizing residuals
To account for variations in brand size, residuals are adjusted by standard deviation:

where
-
Prow = Row total proportion
-
Pcol = Column total proportion


It is with this adjustment that the dominance of well-known brands due to higher recognition is avoided.
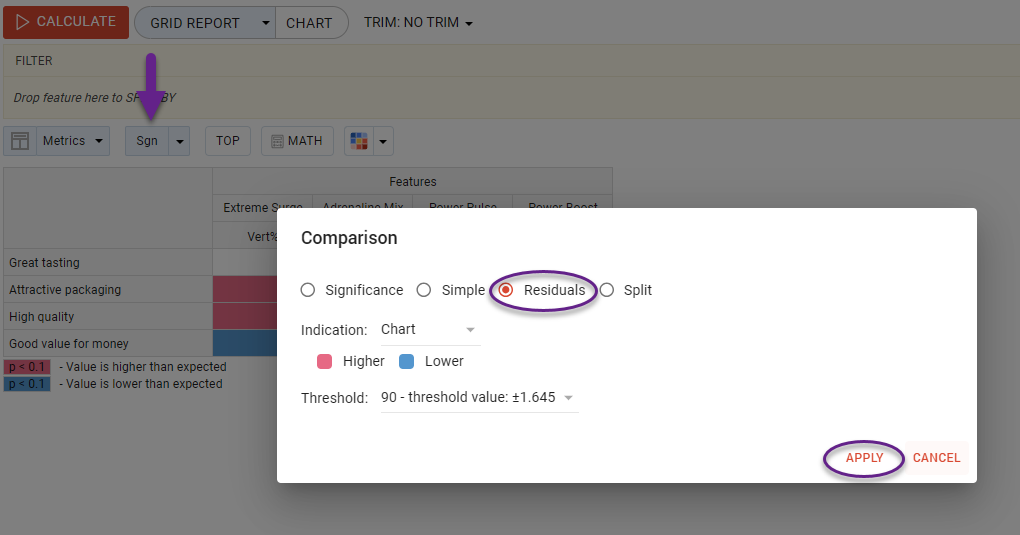
To apply residuals in DVI
Use the ‘SGN’ button above the table and select ‘Residuals’ in the comparison pop-up window.
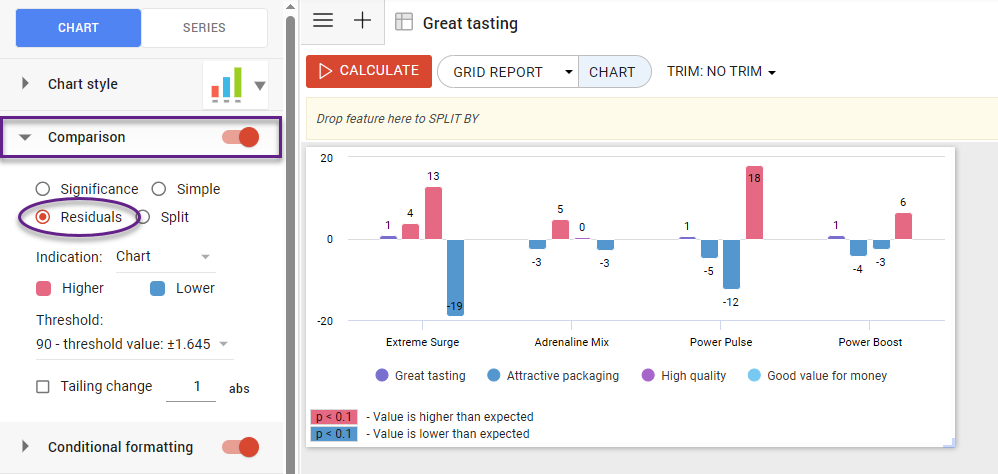
To apply residuals in charts and on dashboards
Toggle the ‘Comparison’ in the left menu pane, select ‘Residuals’, and adjust the thresholds.
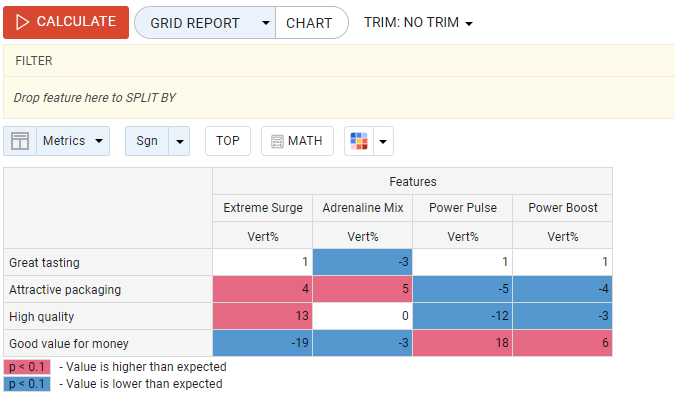
Interpreting the results
Standardized residuals typically range from -3 to +3, with thresholds for statistical significance:
-
±1.645 for 90% confidence
-
±1.960 for 95% confidence
-
±2.576 for 99% confidence
If the residual's absolute value exceeds the threshold, it indicates a significant association:
-
A positive residual shows a strong brand-attribute link.
-
A negative residual suggests the brand is associated with an opposing characteristic.
Residuals within the threshold indicate weak or insignificant associations.