
Exporting to PowerPoint, despite its advantages, involves several technical nuances due to Microsoft’s product specifics. Our team follows a set of rules to handle reports, taking all the subtleties into account while avoiding unnecessary complexity.
PowerPoint export is limited to the functionality available within the software itself. We recommend avoiding complex designer slides with pre-made elements in reports. Hidden PowerPoint settings can cause unexpected results on upload. Keeping slides simple and clean is the best tip for reliable report generation.
Below is a concise summary of our recommended workflow.
Smart template rules
-
Create a master slide with perfectly aligned elements and use it as a base for other slides. Use the ‘Grids and Guides’ option in PowerPoint.
-
Keep all persistent elements: titles, legends, indicators, labels, filters, slide numbers, and section titles — in the same position on every slide.
-
Headings look their best when they stay on one line.
Use chart types that are supported in PowerPoint
Not supported: Word Cloud, Euler, Rank, Sankey, Tornado.
It is also not possible to export charts with mixed series types.
-
Number charts in PowerPoint have limited visual appeal - they’re just a text block with the number. To have a graphical representation similar to the number chart with a diagram that is possible in DataTile, it’s recommended to use a pie chart with the appropriate settings.
-
The only chart type that supports conversion display in PowerPoint is the Funnel.
-
Rank charts and Dot Plot charts can be exported as regular column charts.
-
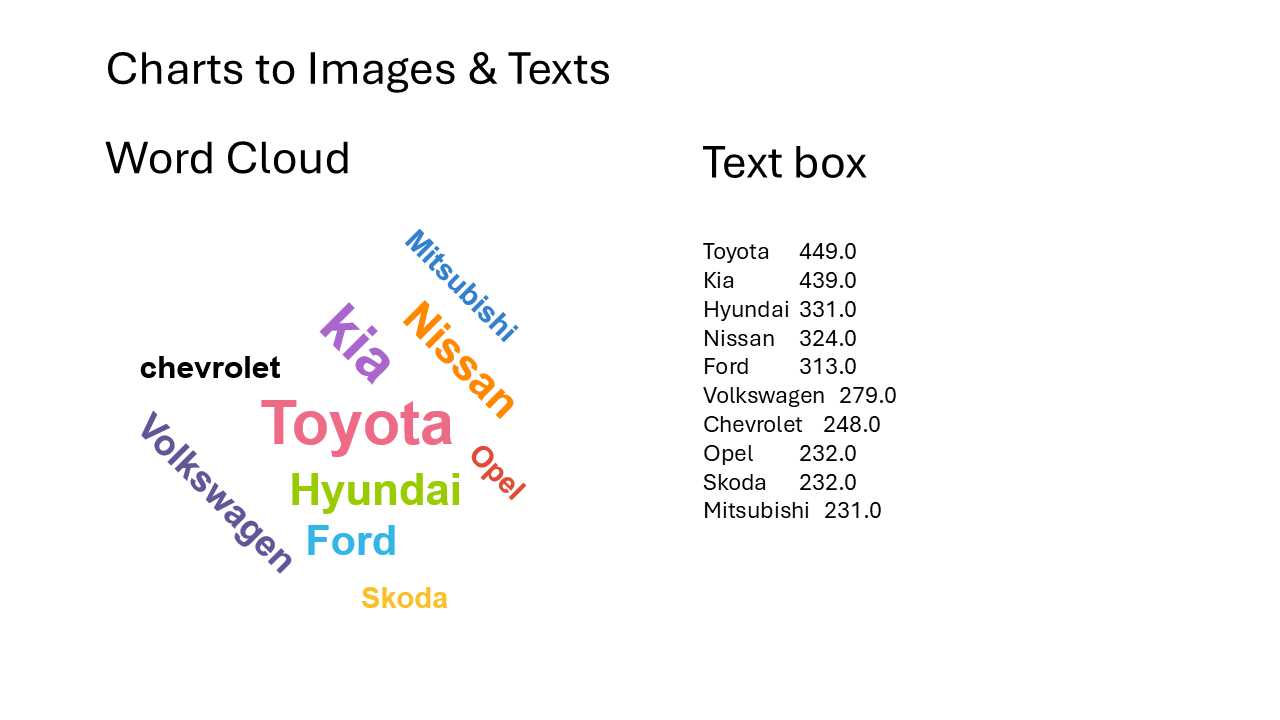
Word Cloud charts can be exported as images (or texts).
-
Raw data is exported only as standard text blocks, with one row = one text line. The visualization cannot be edited.
How to handle chart elements
The position, size, and fonts of all elements are defined on the slide.
Series
All charts intended for export must have automatic axis settings enabled.
Although axis labels are exported from the dashboard, we strongly recommend planning their placement in the template based on real data to ensure that label length and size do not cause layout issues. A quick approach is to export the data from the dashboard or crosstab to Excel, copy the labels, and paste them into the data source file in PowerPoint.
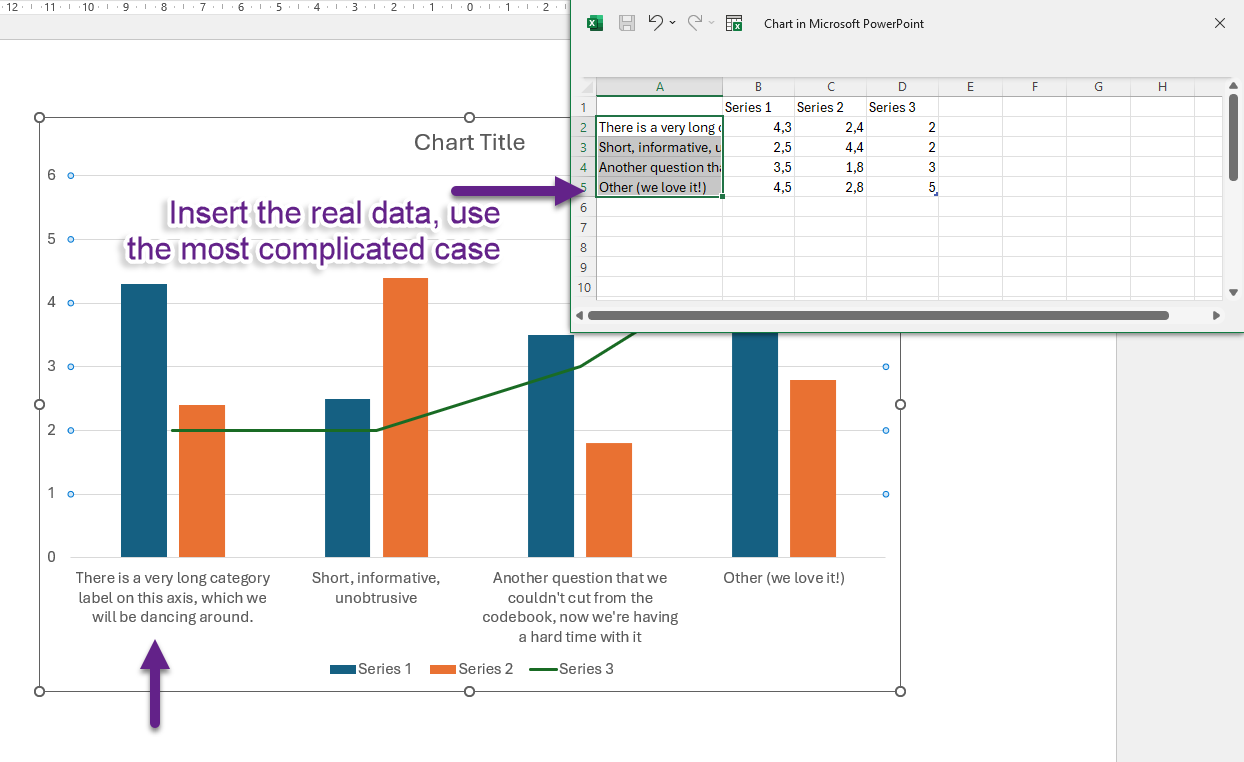
Series colors are also defined on the dashboard. Avoid setting custom chart colors in templates; they will be replaced during export.
Title/subtitle
The chart title is exported, but the description is not.
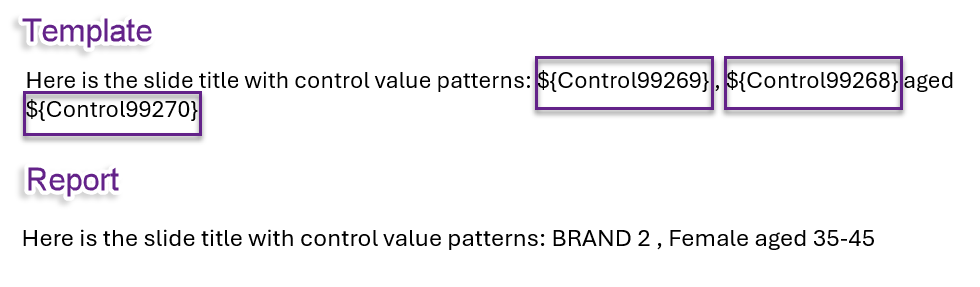
To display a chart title with templated values, skip the built-in title and add a text box instead.
Text Blocks
In text blocks, you can encode control values and even the entire content of tables and charts in text form, using the same syntax: ${Element_ID}.
For example, the Word Cloud chart can be exported as text.
Best uses for text boxes include:
-
Slide and chart titles,
-
Subtitles with variables (e.g., KPIs),
-
Significance legends,
-
Any technical information that needs to be presented (base, indicators, explanations).
For exports to work, all related controls, charts, and tables must be created on the dashboard first.
Below is an example of how a chart title from the template appears after export.
Logos / Images
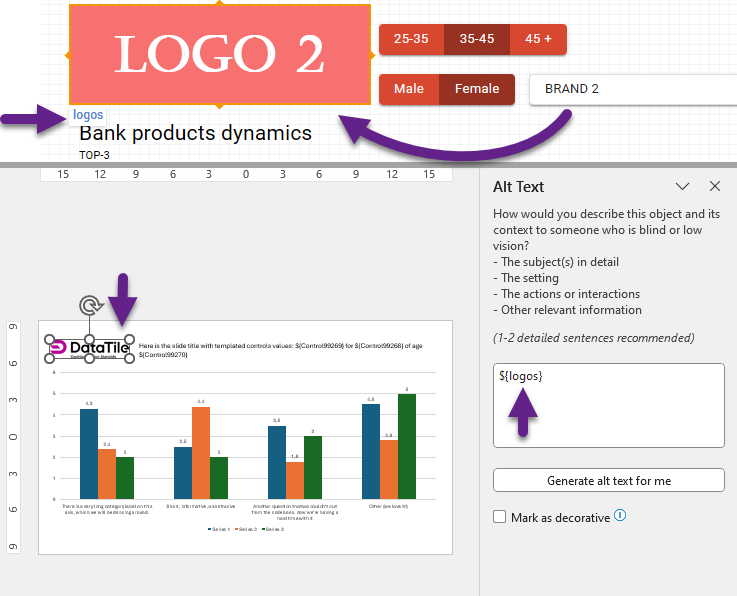
Images are exported from the dashboard and are presented according to the selected control options. To enable this, an image bundle is uploaded and bound with controls on the dashboard.
In the template, insert any placeholder image, position it, and set its size (use the largest logo as a reference). Then, enter the image bundle title in the ‘Alt Text’ field. The report will display the image from the dashboard that matches the selected control option, just like it does on the dashboard itself.
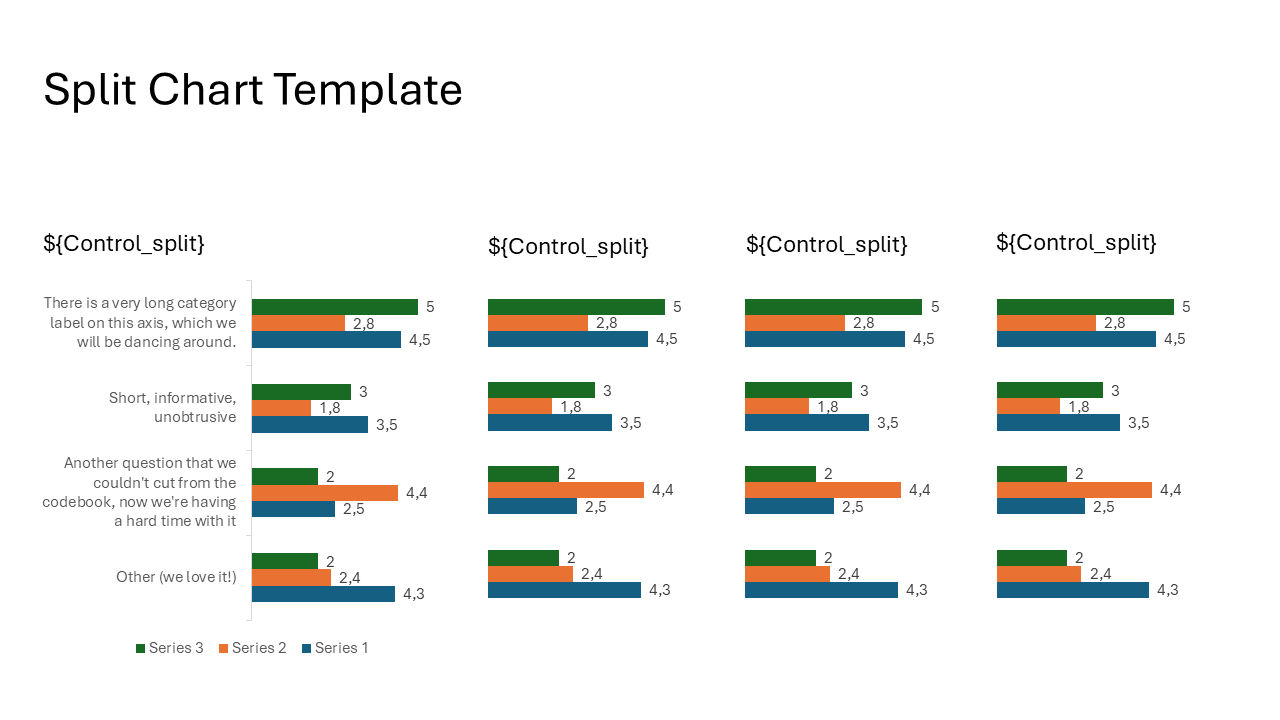
Split charts
When exporting splits, you can create and adjust several placeholders for them.
If placeholders are not created, the system will automatically duplicate the existing chart, creating a separate slide for each split. It may be acceptable, but in most cases, all splits should appear side by side.
-
Create the first placeholder with legend and axis labels. Remember the tips for adjusting labels.
-
Create the templated text box as the chart title. Maintain spacing between the split title and bars.
-
Copy the first chart and delete all elements that are not supposed to be repeated for each split.
-
Create other placeholders and align them respectfully. Note that the chart title alignment differs for the first chart and for the others.
-
Each chart placeholder must have the same Alt Text -> the source chart ID.
-
Each text box, aka chart title, must have the same Alt Text -> the source control ID.
Enable splitting in chart settings only if you intend to export a split chart.