
You can use controls to set date periods if you have a date variable in your database.
To use dates in the control:
-
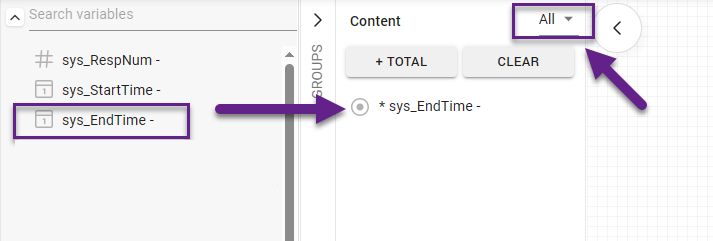
Create a Range control.
-
Select Multiple selection mode.
-
Place the date variable on the control, using the selection strategy ‘ALL’.
Please note that the range cannot be adjusted in EDIT mode. All control actions will occur in VIEW mode.
After creating the control, you can assign it to the chart as needed. For example, in our case, we will look at respondents who made specific purchases by date during the pre-Christmas week. To do this, we created a chart, placed the variable ‘States’ on the rows, and the control with the calendar period was assigned as ‘Put on Split’.
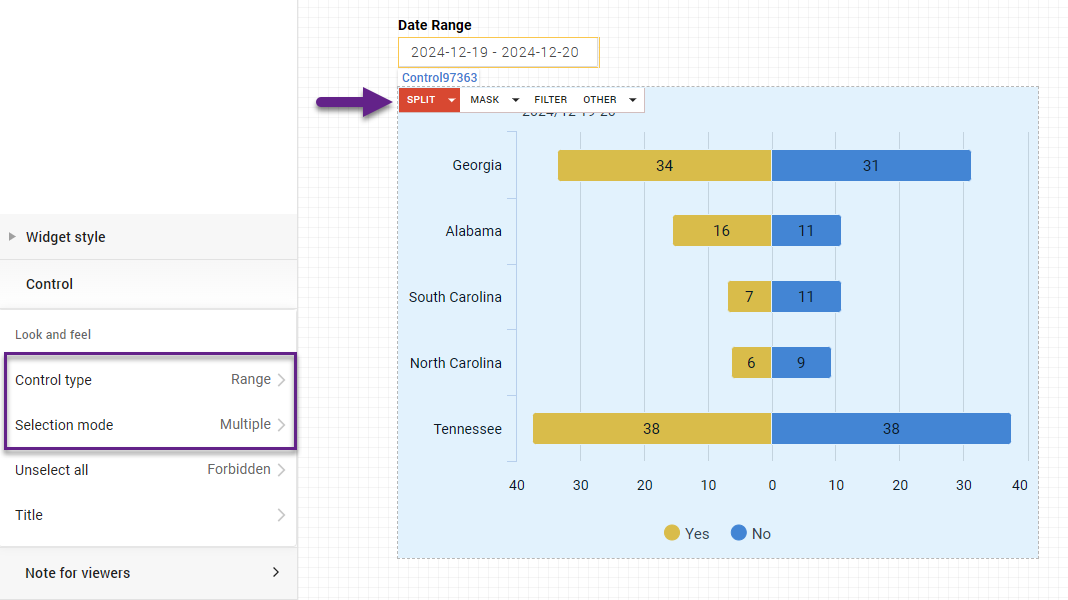
For now, we have one control and one split. But after we duplicate the control multiple times and assign all copies in the same way on the split.
To visually separate the splits, select the chart and activate the split toggle in the left menu.
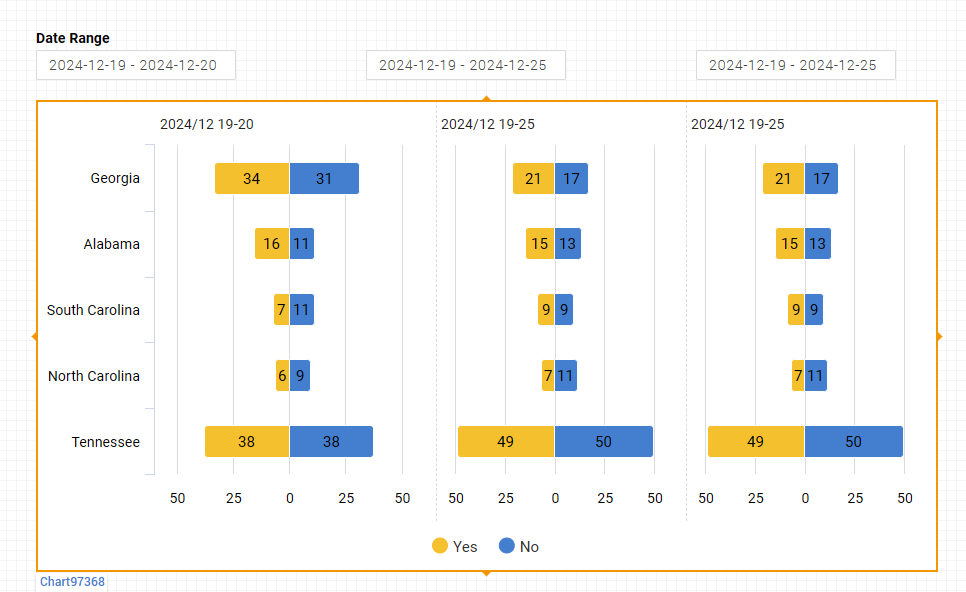
Now, let's switch to VIEW mode and adjust the ranges for all the splits.
Click on the control, and a calendar will appear. From there, select the desired date ranges.
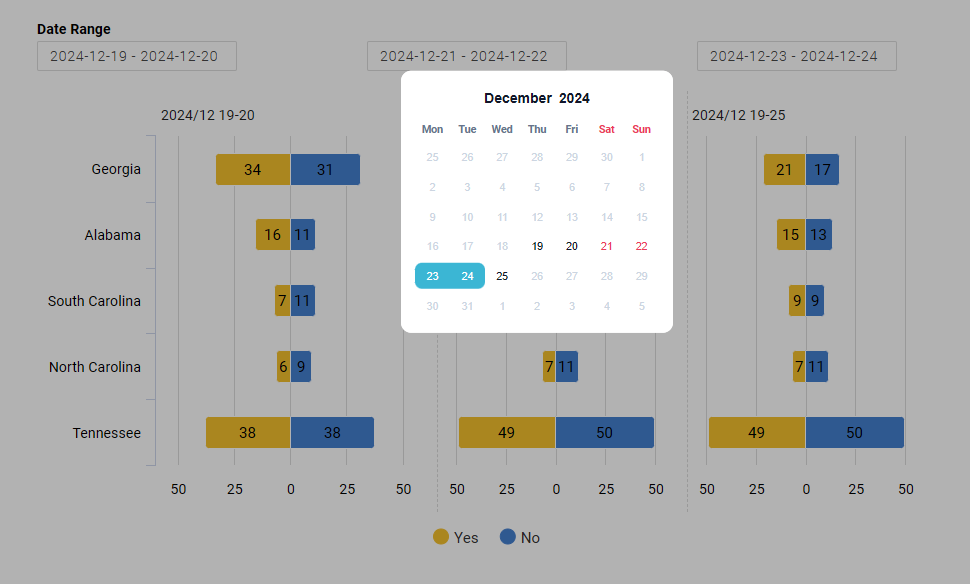
Manually entering dates is not allowed.
As a result, we get three charts displaying respondents by days (with a 2-day range) before Christmas.
The calendar always shows the date range that can be selected (based on the data in the database). It can also be assigned as a filter, mask, etc.