
Update tracker PowerPoint reports are no longer a time-consuming part of work in DataTile. With DataTile Report Generator, you add the latest survey data to your existing report templates: every download gives a new PowerPoint report with the current data.
How it works
Setting up Report Generator takes 4 steps:
-
Build a PowerPoint template with placeholders for charts, tables and text (this page). Read our best practices first.
-
Build a custom dashboard with all elements for the report.
-
Link the placeholders to the dashboard elements.
-
Upload the template to the dashboard and download reports whenever new data arrives.
Creation of a PowerPoint Template
Open Microsoft PowerPoint and create a new presentation, or reuse a PPT file from an earlier tracking report. Save it as PowerPoint Presentation (.pptx).
-
Decide on the design elements you want to incorporate into your template. You may want to consider incorporating your company's branding elements, such as logos, colors, and fonts.
-
Consider the slide layouts that you want to include in your template, such as title slides, content slides, and chart slides. You may need to have different sections or sub-sections too.
Below is an example of a small tracker report template. You can add as many slides as you need.
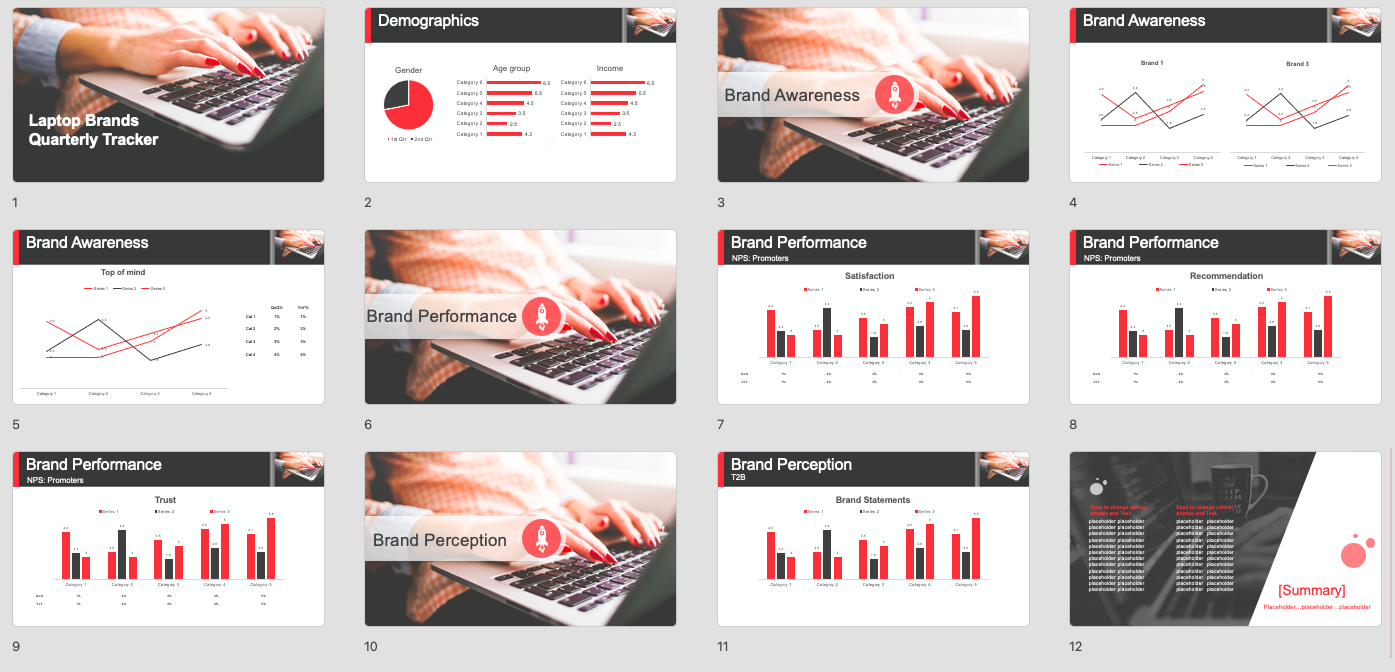
Hierarchy of elements: Template vs. Dashboard
There is a hierarchy of elements that determines what information comes from the template and what information comes from the dashboard.
The key rule: the dashboard is a dynamic data source that feeds a static template. Dynamic elements from the dashboard, such as numbers, legends and colors, fill the template. Static elements, such as chart type, chart position, titles and design, are set in the template and appear in the final deck whatever changes are made to the dashboard.
|
Template |
Dashboard |
|---|---|
|
|
Example 1: Line chart
The video below shows how to create a line chart placeholder.
Top Tip: To ensure consistency in the template, use the same chart type for each category and duplicate it as needed. For example, create one style of line chart with all edits, then copy and paste it wherever other line charts are needed.
Example 2: Table of changes (QoQ% and YoY%)
The video below shows how to create a table of quarterly and yearly changes.
-
We recommend that placeholders for tables and charts contain the same number of columns or rows as the widgets on your dashboard. This gives you more control over the final output.
-
You should also align the cells/columns with each bar. Since chart and table placement is a static template element, ensuring this is perfect beforehand can save you time.
-
The text from the dashboard will override any text within the table.
Tip: Preparing space for long chart labels (e.g., brand images, evaluations)
a. Make the chart’s outer container wide and the inner container narrow.b. Reduce the font size of the labels so they fit during export.
c. Align labels to the right if they wrap into two lines.
More tips for perfect template creation are here.
Common mistakes
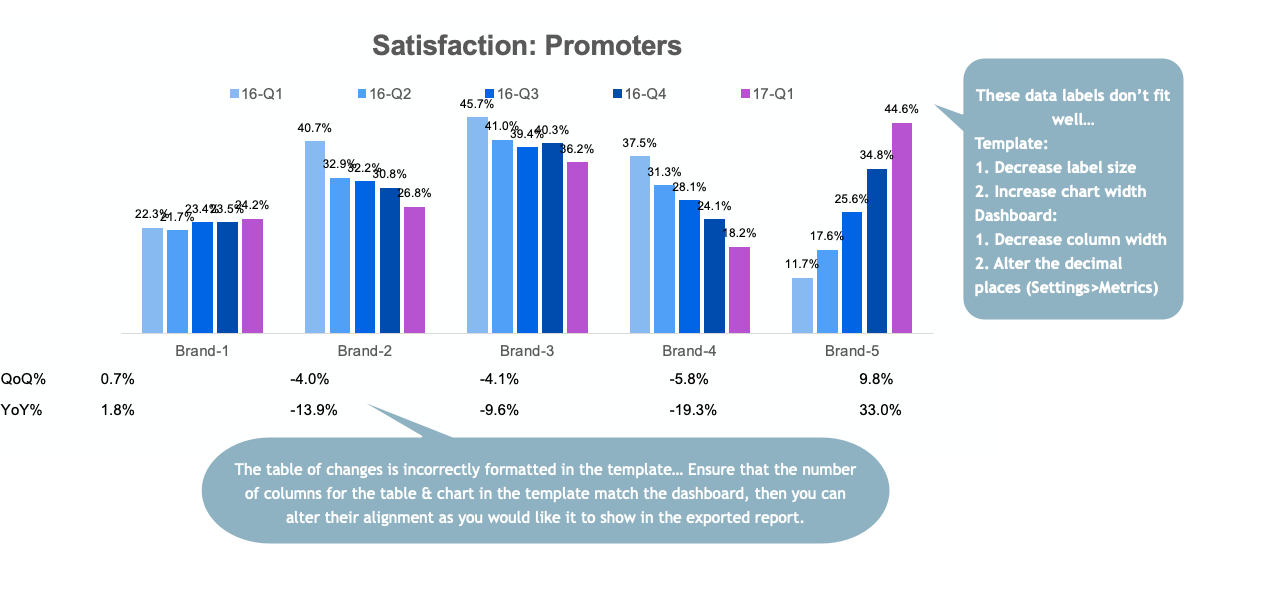
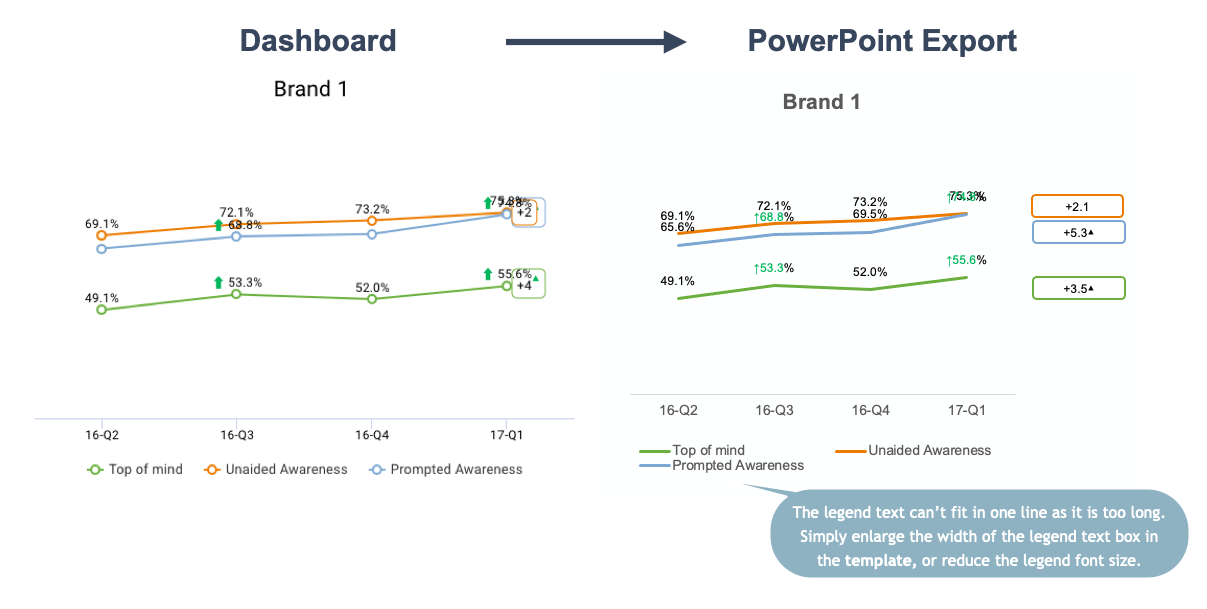
For more problems and how to fix them, see troubleshooting.
When the PowerPoint template is ready, save it and go to the dashboard to create all elements for the report.