
Here’s a quick overview of the main news in DataTile in June:
-
Based on user feedback, we’ve upgraded the display of Stat.Base both in the crosstabs and when exporting from dashboards.
-
Stat.Base is now available when exporting GRID reports to Excel.
-
New metric: Aff.idx (Total).
-
Ability to apply trimming rules to options in the TURF chart.
-
YAML script error notifications.
Stat.Base calculation in the crosstabs
When using the statistical base as a mathematical (MATH) function, it doesn’t require an argument. Previously, this always returned the total base in a crosstab, which wasn’t always the intended outcome, especially when you need to show the base for a specific query, such as when using the “Ignore SYSMIS” strategy.
Now, the statistical base in a crosstab works as follows: it returns the base of the first option in the row or column that doesn’t contain any logical or mathematical operations.
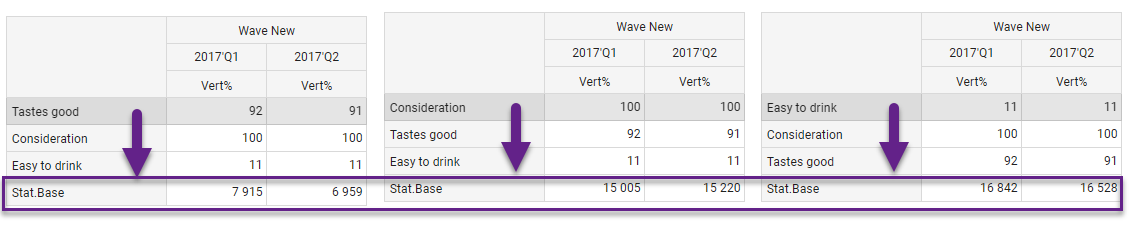
In case there are no such rows, it will return the Total Stat.Base.
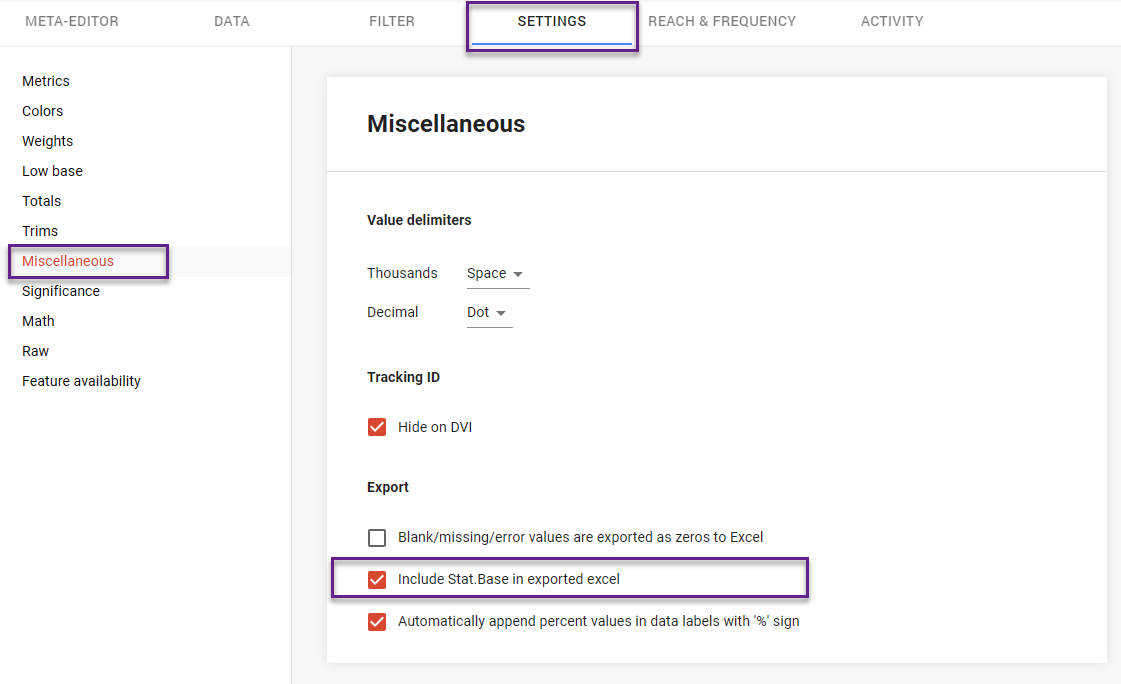
Exporting Stat.Base to Excel
When exporting a dashboard to Excel, you can enable the automatic export of Stat.Base, this option is available in the base settings.
Previously, Stat.Base was always placed in rows. Now, the export respects the selected orientation for options: if series are set to columns, Stat.Base will appear in a column; if set to rows, it will appear in a row accordingly.
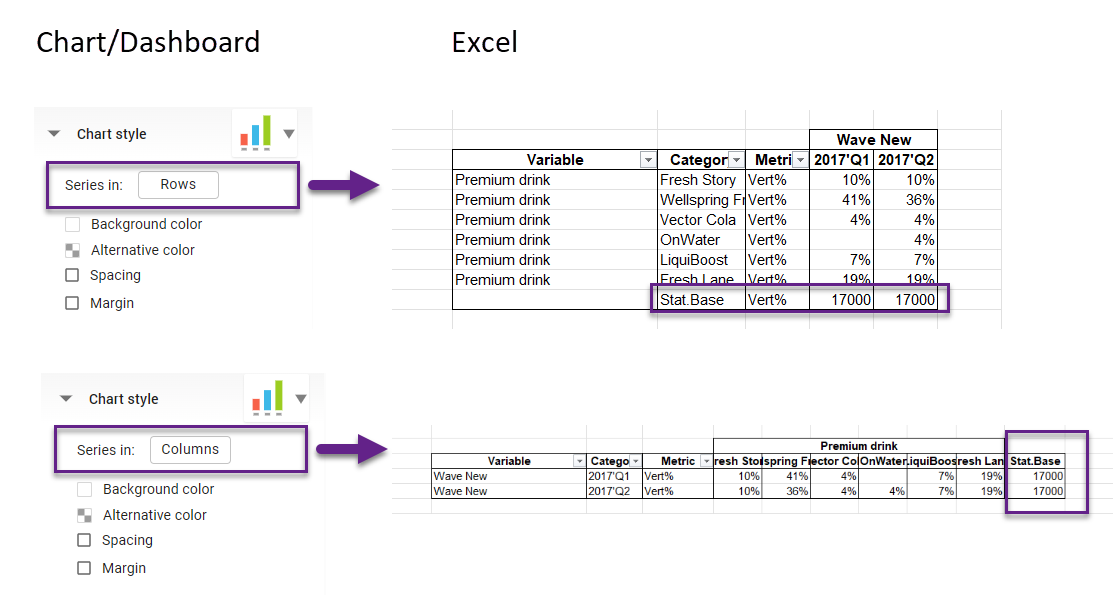
Stat.Base now is available when exporting GRID reports to Excel as well
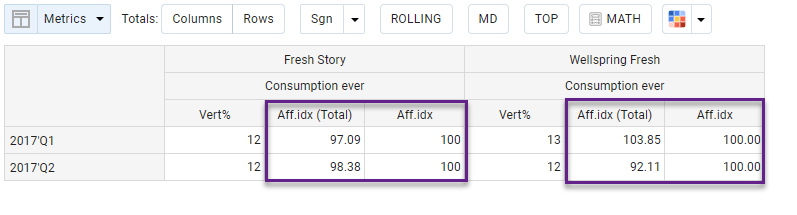
New metric: Aff.idx (Total)
The Aff.idx metric is calculated as 100 * (Category Vert% / Total Vert%).
The new metric - Aff.idx (Total) - uses vertical percentages based on the overall total, ignoring both rebase settings and SYSMIS policies.
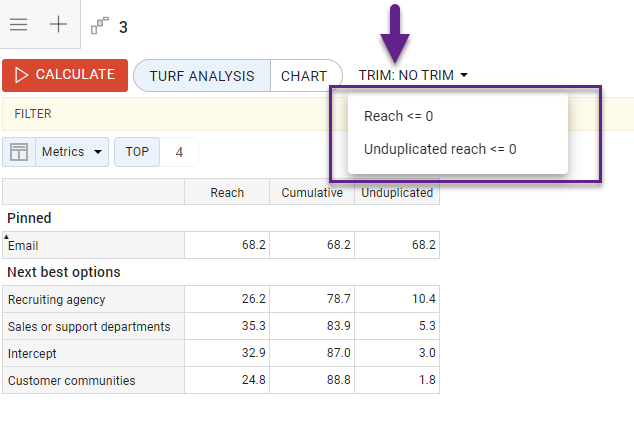
Trimming rules in the TURF chart
TURF analysis is used to identify the optimal combination of features that maximizes total reach without duplication. The TURF analysis chart now includes custom trimming options to help you focus on the most impactful combinations. You can choose to:
-
Hide options that don’t contribute additional reach (Reach <=0);
-
Hide options that are fully duplicated by others in the set (Unduplicated reach <=0).
These settings make it easier to interpret results by excluding items that don’t improve overall reach.
YAML script error notifications
To automate chart data export into the Report Generator, you can use a YAML script. This script is sensitive to errors: if even a single character in a control option label doesn’t match, the chart for that option won’t be exported.
We’ve added an error notification feature in DataTile: now, if a chart fails to export due to a mismatch in control labels, you’ll be promptly alerted via in-app notification. This allows you to quickly identify an error and fix the code.