In October, our team completed the major task: transitioning to a new charting library, which will soon be rolled out across all DataTile servers. We've also improved dashboard color customization and added the ability to export Quantitative MR sets to codebooks and declare them directly in codebook files. Below, you'll find more details on these updates, along with several other useful improvements.
Migration to the Vega chart library
The migration to the new Vega chart library is taking place across all DataTile servers throughout October and November. This upgrade lays the groundwork for more flexible visualizations and future charting enhancements.
Key benefits include:
-
A stronger technical foundation and faster performance for complex visualisations.
-
More consistent rendering and styling across dashboards; in particular, more stable performance of chart legends and labels.
Quantitative MR-sets in codebooks
Quantitative MR-sets created in the DataTile interface are now included in codebook exports. You can also declare quantitative MR-sets (MQ) directly in a codebook, rather than creating them manually in the interface.
To define a quantitative MR-set, use MQ (or MRQ) in the TYPE column of the VARIABLES sheet. This functionality is available only in the Сodebook v2.
Quantitative MR-sets support the standard MR-set structure, including variable masks, labels, folders, and visibility settings.
This article describes in detail how to declare an MR-set in the codebook.
Codebook updates in the activity log
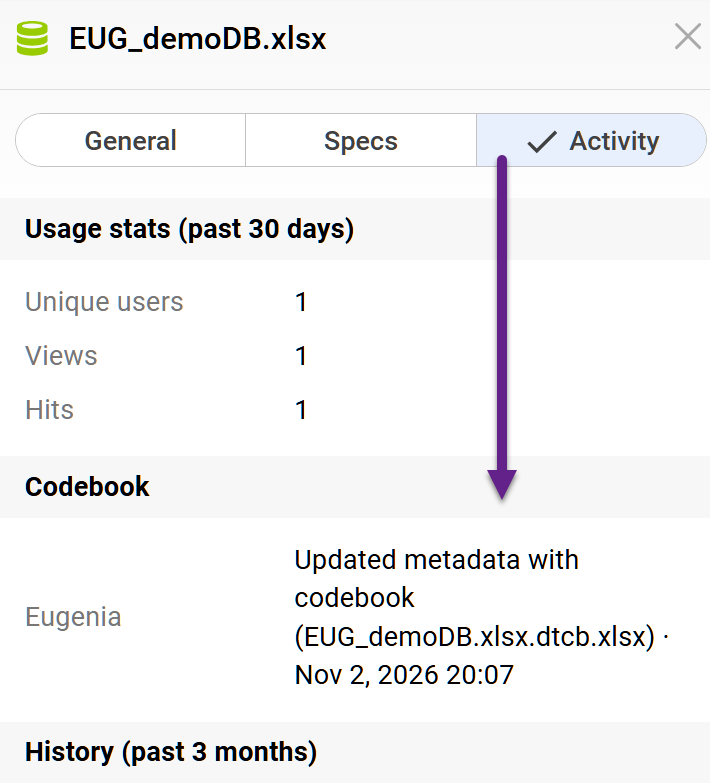
The Activity section of the Info Panel now tracks metadata updates made through codebook uploads. These events are recorded as “Updated metadata with codebook”, making it easier to track changes to database metadata.
Limiting the number of combinations in a proxy collector
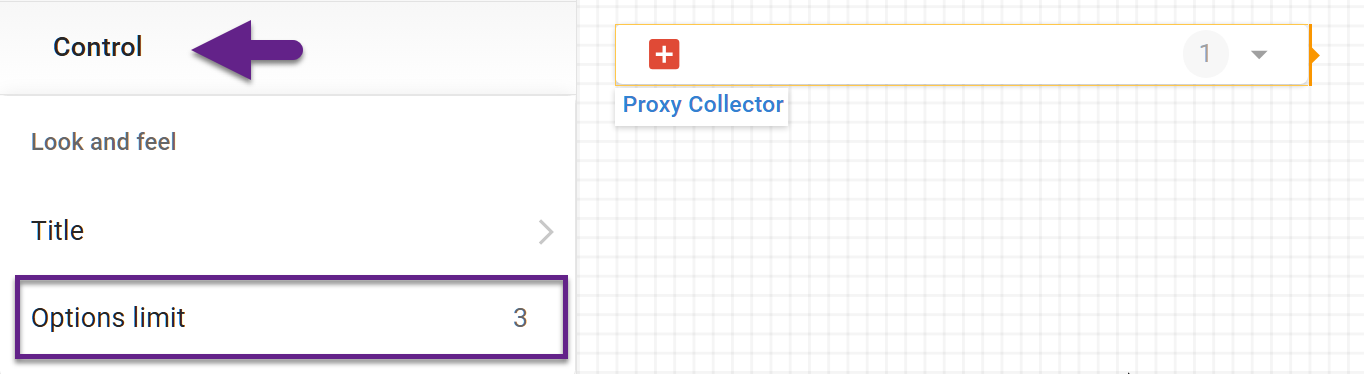
A dedicated setting allows you to limit the number of options in a proxy collector to a specific number. This can be useful when creating dashboards for a specific audience where, for example, only three combinations need to be shown, and increasing that number would create clutter or add unnecessary series to the charts.
In EDIT mode, select the proxy collector and set the options limit in the control menu.
Custom widget colors on dashboards
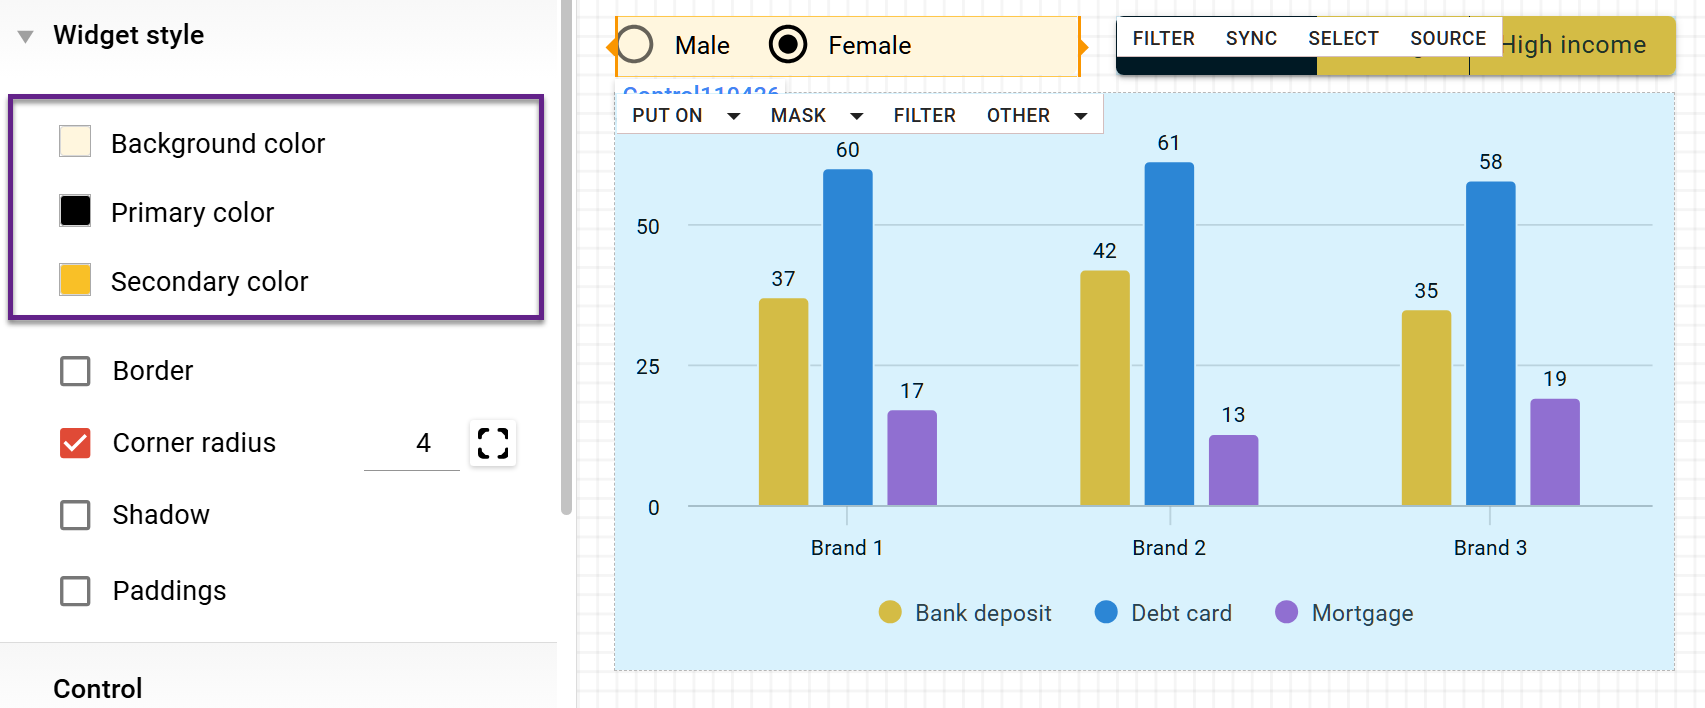
Additional settings in the widget menu now allow you to customize control colors individually. To do this, select the control and use the Widget Style menu to configure the following colors:
-
Background color.
-
Primary colour (indicates selected options).
-
Secondary colour (indicates non-selected options in the button control).
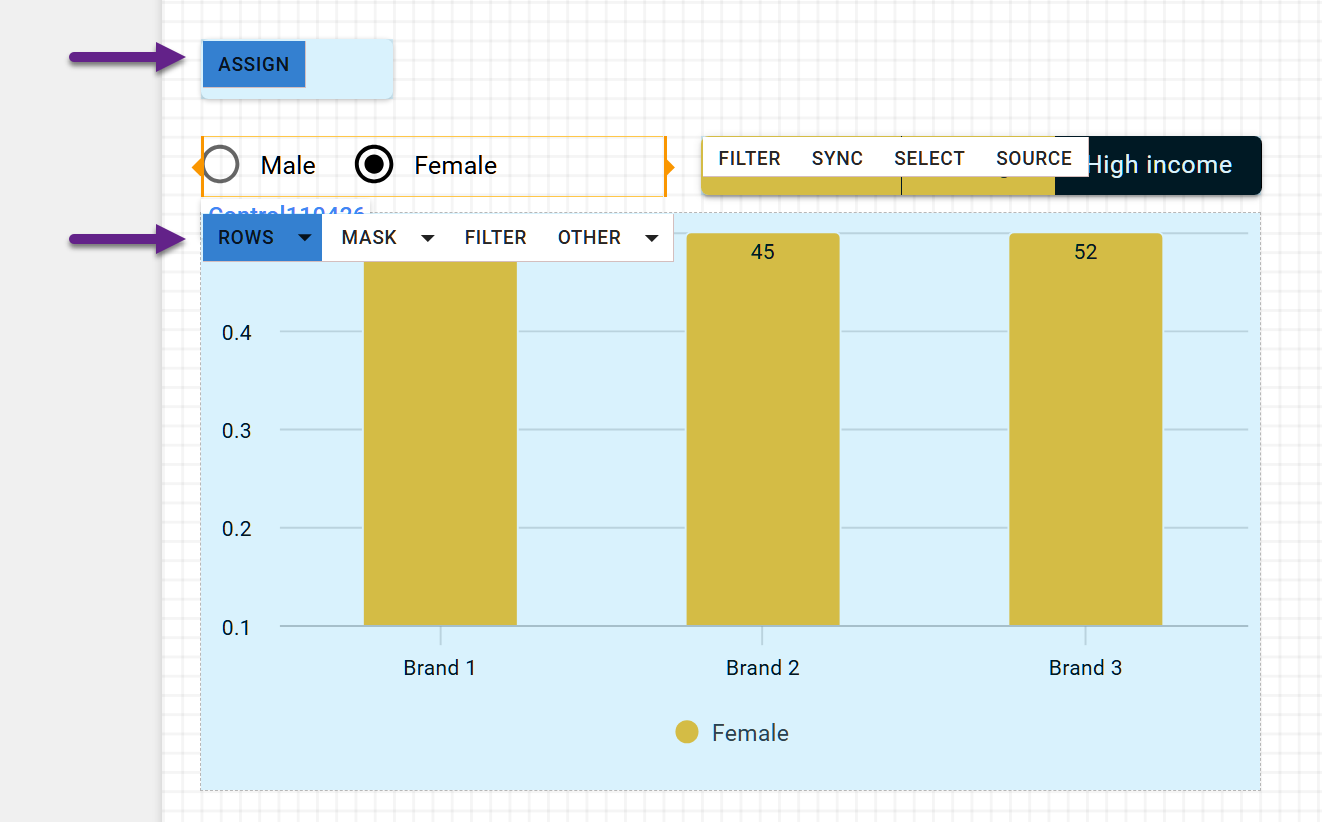
Assignment panel color
The active option highlight in the Assignment panel is now independent of the Common Styles color scheme. The selected option is displayed in a contrasting shade of blue, making it easier to identify at a glance.
Custom decimal values for chart axes
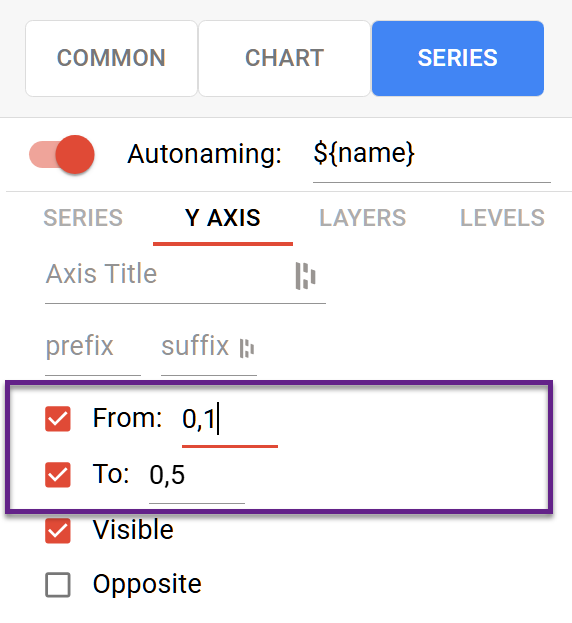
We've improved chart axis settings to give you greater control over scale limits. You can now specify custom decimal values to fine-tune axis ranges and achieve more precise data visualizations.