AI-assisted sentiment analysis groups respondents by sentiment from open-ended responses, comments, or feedback. AI automatically detects sentiment (positive, negative, or neutral) and structures the results, making it easier to identify trends, measure satisfaction, and uncover key issues.
To use this feature, the AI connection must be configured on the server. By default, a standard LLM model is used.
Required role: Sentiment Analysis
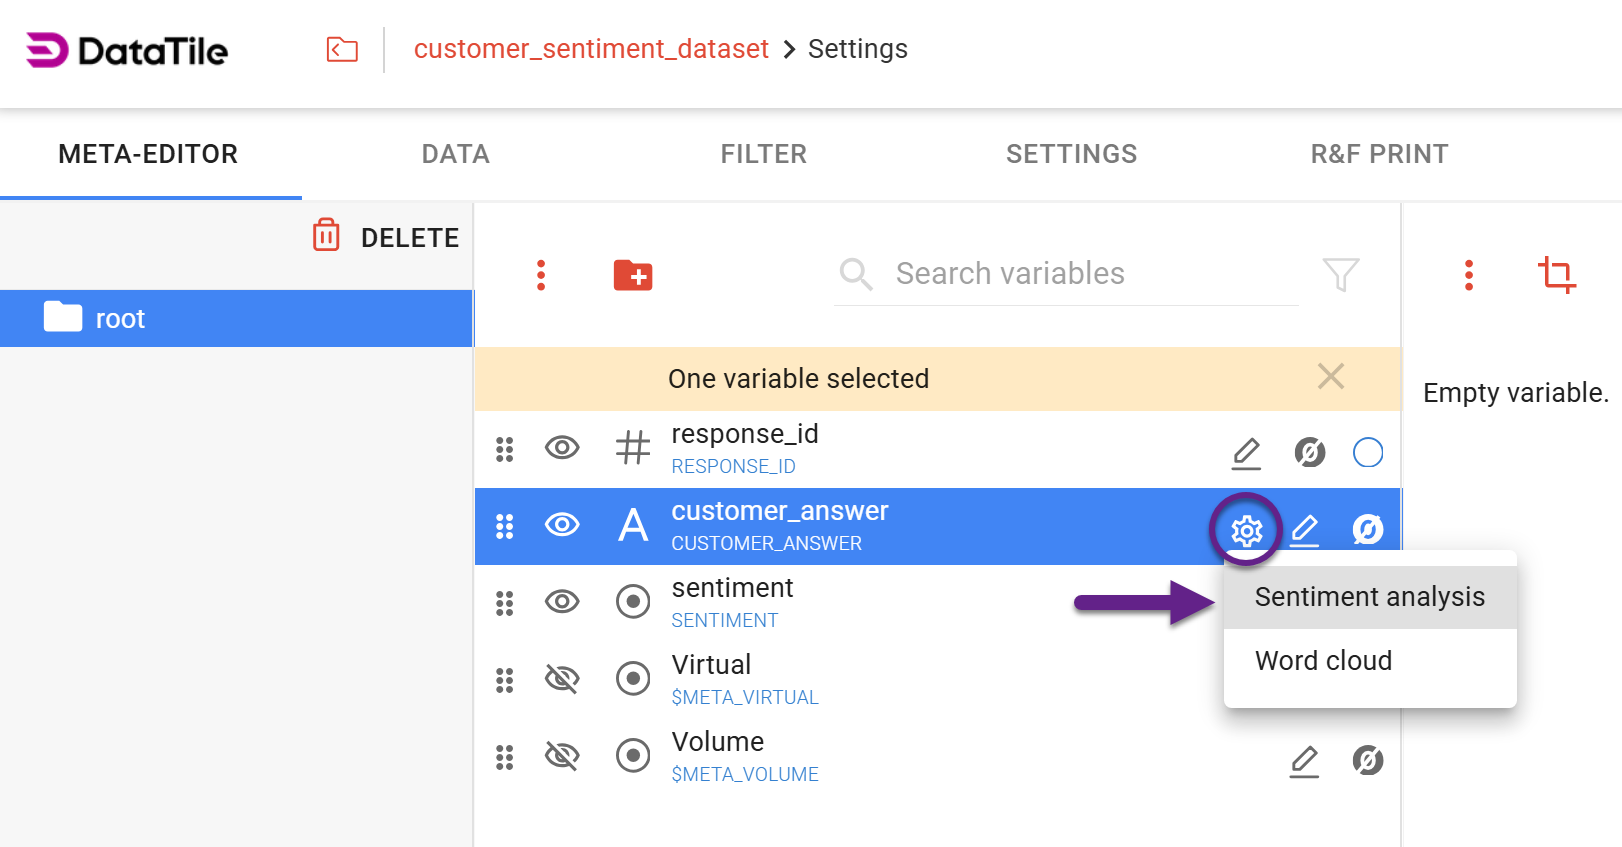
Users with Editor permissions and the Sentiment Analysis role can start the process by clicking on the ‘cog’ icon next to a text variable and selecting the ‘Sentiment analysis’ option.
In the settings window, you can define the minimum number of characters required for a text to be included in the analysis, and edit the group labels.
By default, all data is divided into six groups, as shown in the image below. The number of groups cannot be changed at this time, but you can adjust their visibility after the analysis is complete.
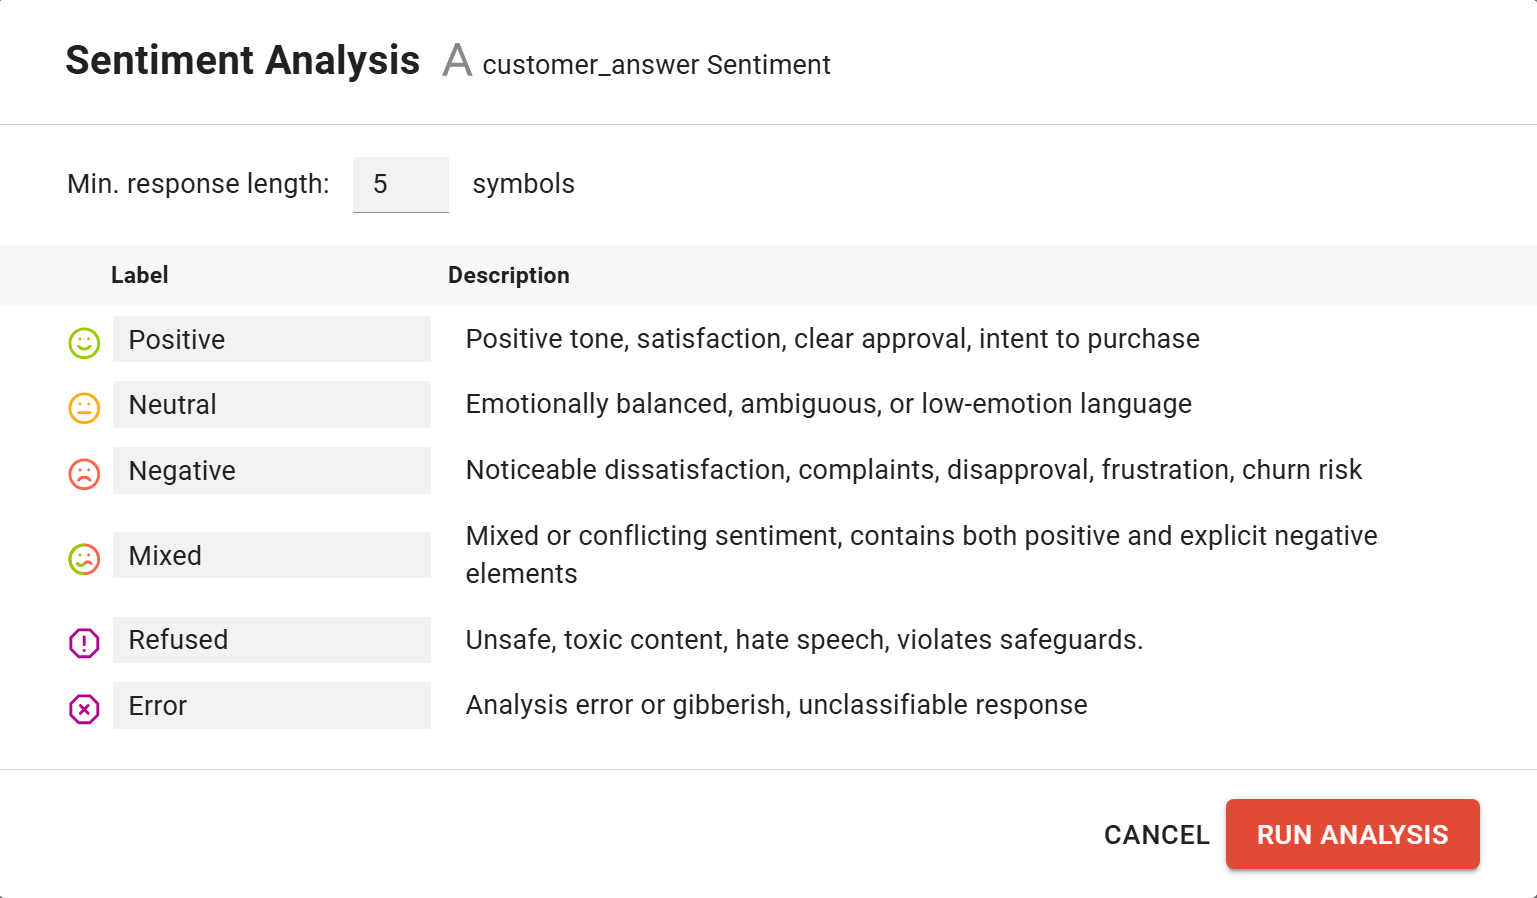
After clicking Run Analysis, the process runs in the background. Depending on the data volume, it may take from a few seconds to several minutes. You will receive a standard in-app notification once the process is complete.
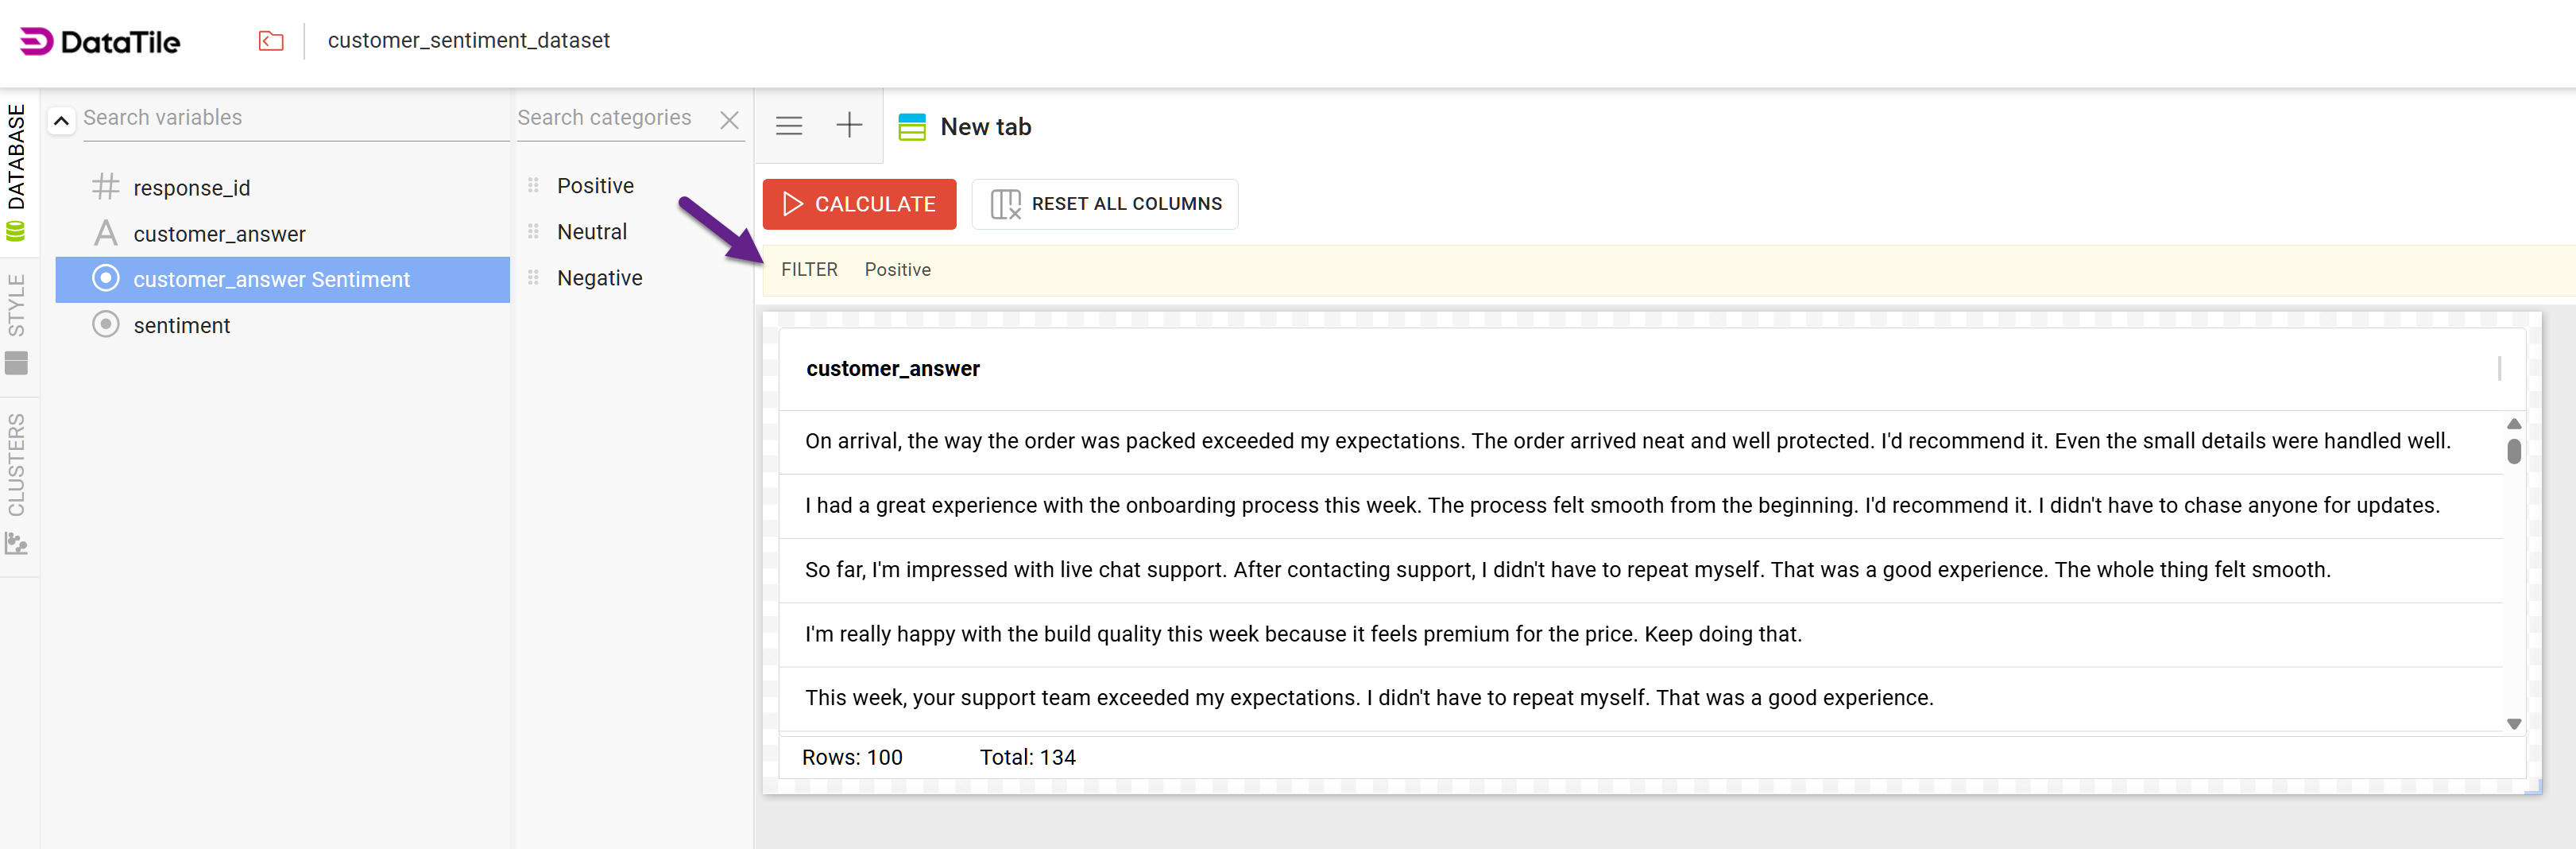
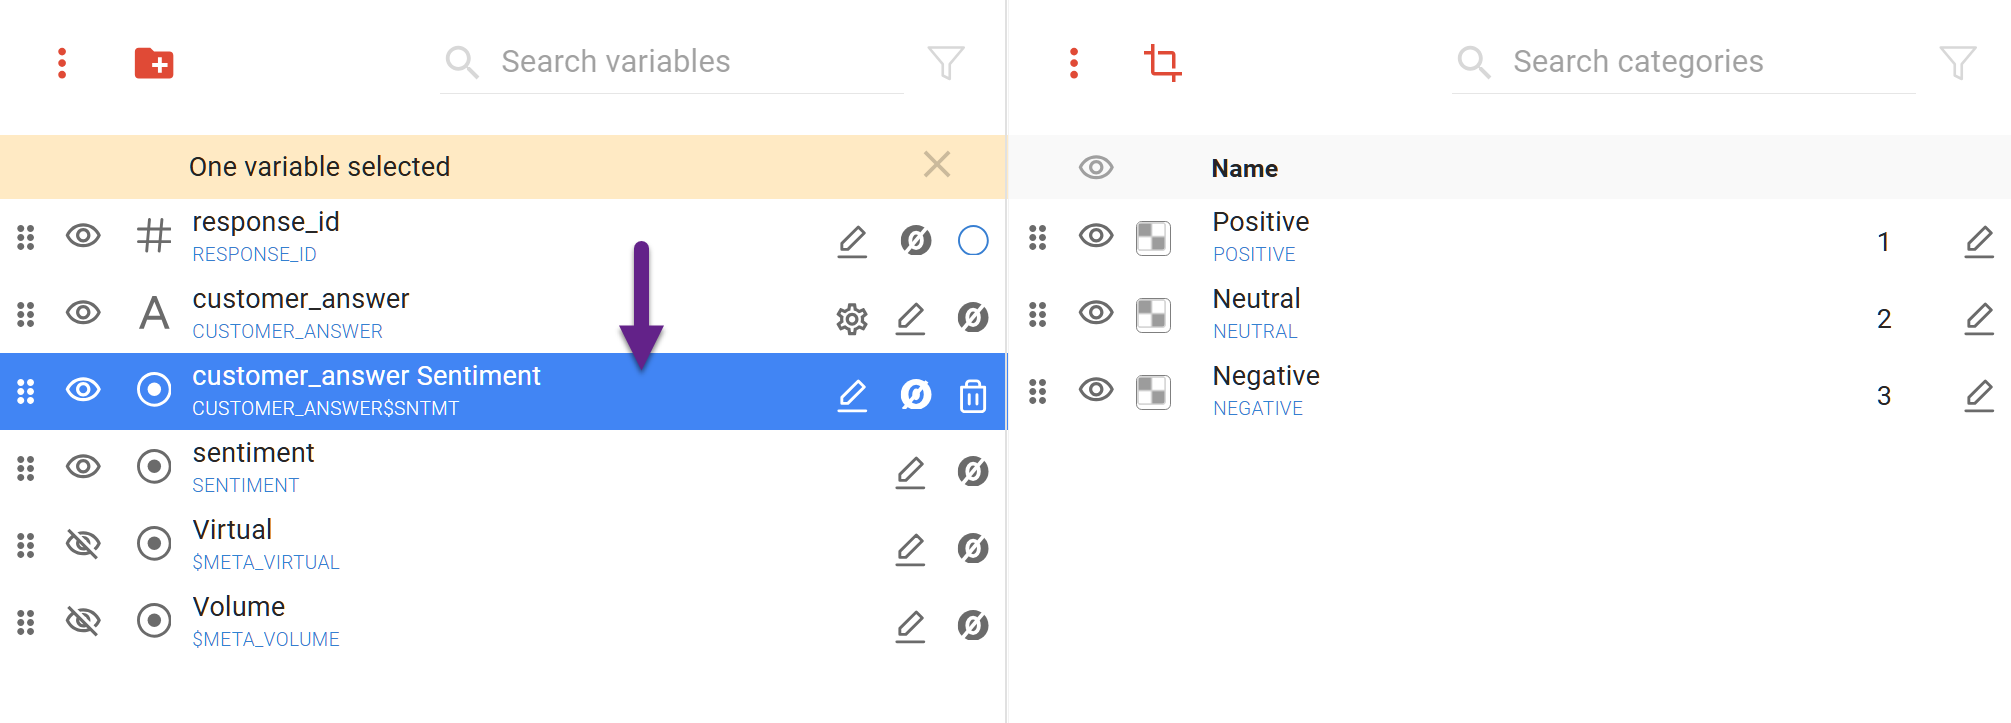
Once completed, a new variable with the ‘Sentiment’ mark will appear under the original variable. You can work with it just like you would with a standard categorical variable.
If any of the default groups do not contain values after the analysis, they will not be created.
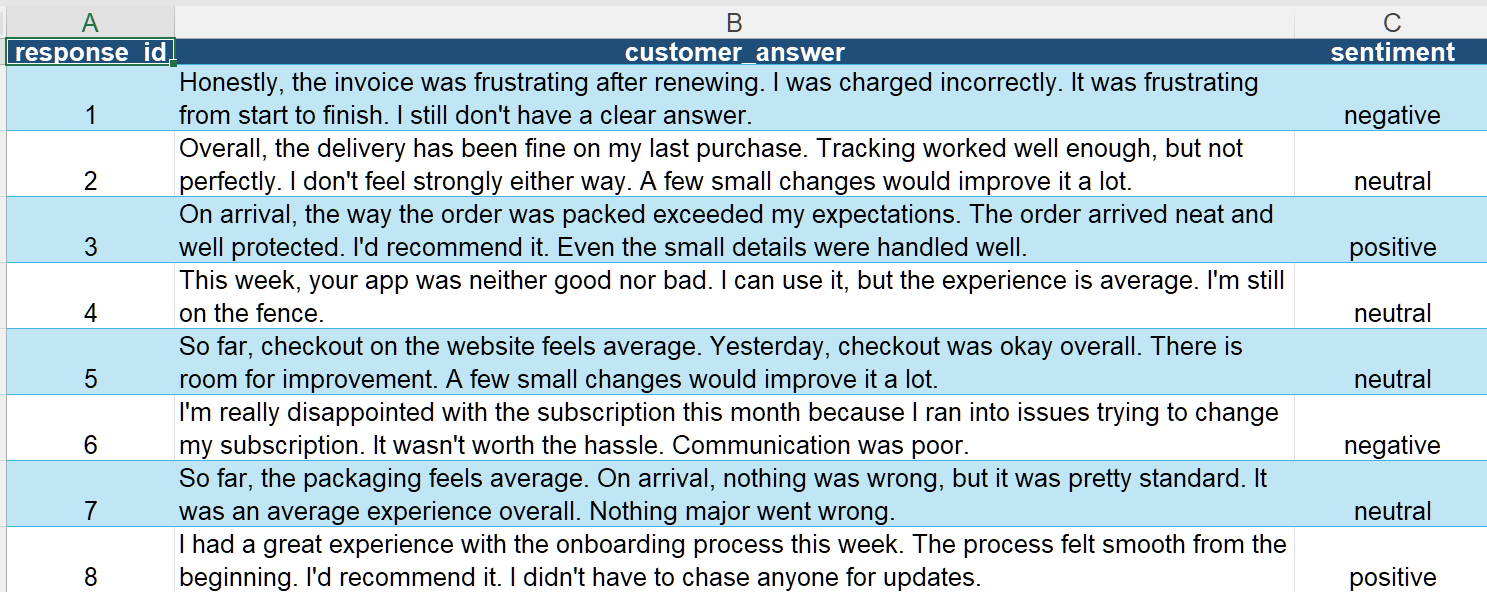
Example Dataset
For our test analysis, we used a dummy dataset with fake customers' feedback. For verification purposes, an additional variable with explicit sentiment labels was also created. This allows us to validate the AI results.
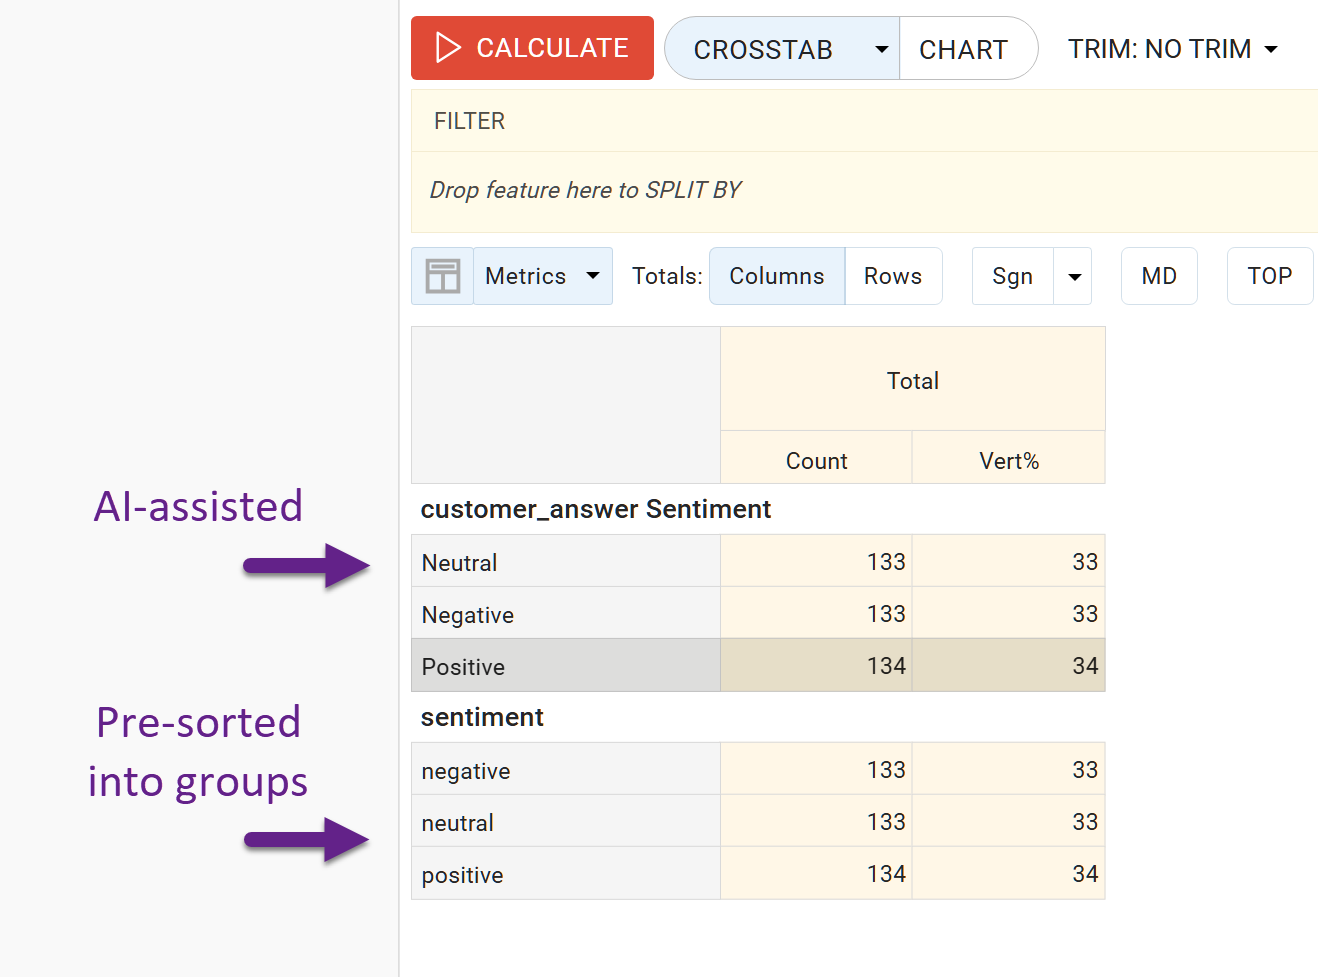
The dataset contains 400 records, distributed as follows. As shown, the manually assigned labels and the AI-generated results fully match in this case.
By using the ‘Raw Data’ chart and the ‘Sentiment’ groups as filters, we can display the raw data and examine specific phrasing.