
DataTile charts support conditional formatting, which allows you to highlight specific series based on predefined conditions. When a condition is met, the selected color scheme is applied, making the relevant data easier to identify visually.
You can define multiple conditions simultaneously using special expressions. This article explains how conditional formatting works and covers its available settings and configuration options.
Conditional formatting settings
Conditional formatting is configured in the chart settings, available in the left-hand panel both in DVI and on a dashboard. First, enable the option using the toggle, then click Add new condition.
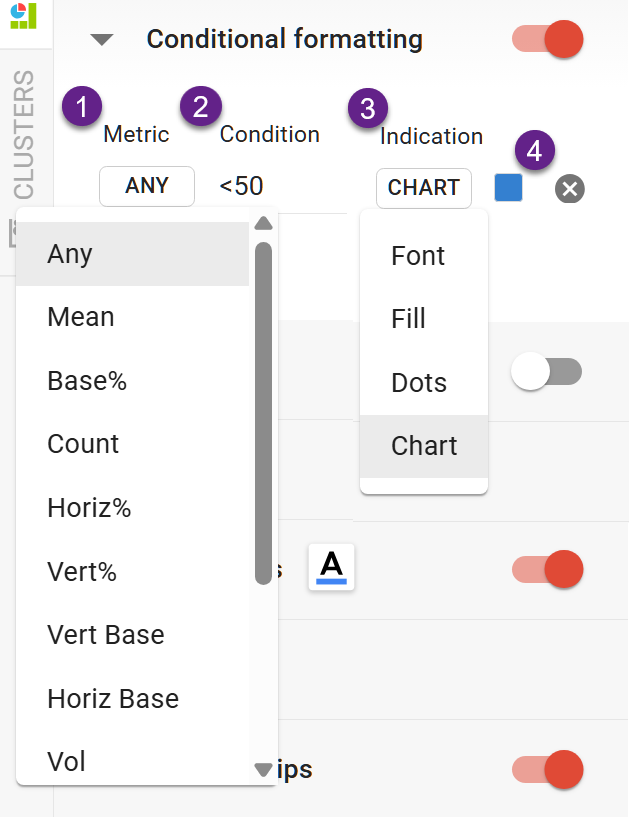
Here you can define:
Metrics (1)
The metrics used in conditions do not have to be presented in the crosstab or chart. You can use any metric in a condition, and DataTile will evaluate it in the background. Here you can see conditional formatting based on VERT%, while the chart itself displays Counts.
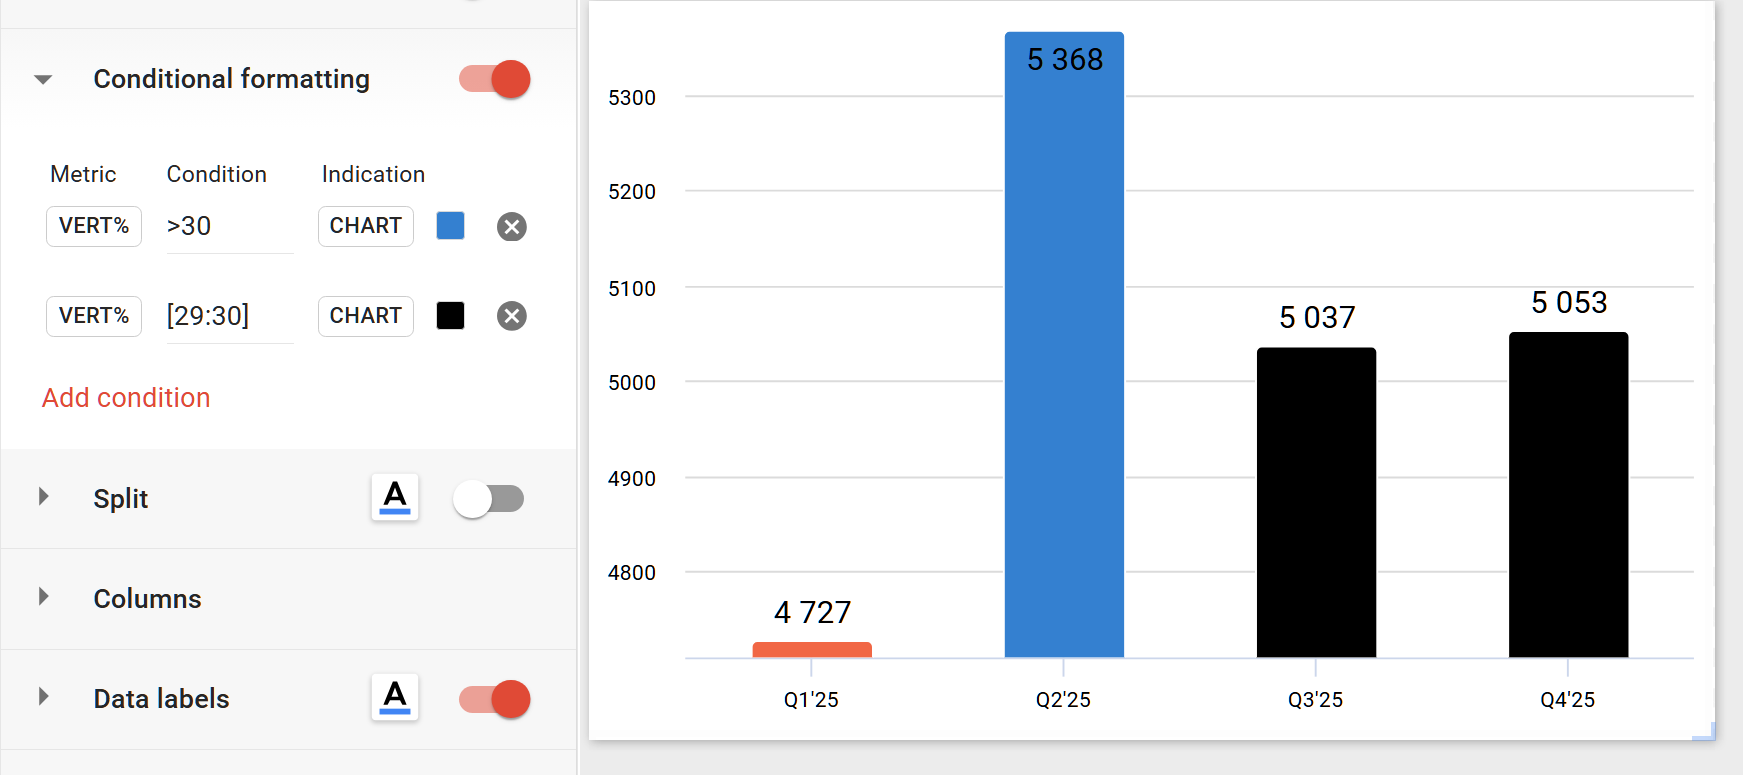
In the same way, you can use color to highlight series with a low base without displaying the base value itself in the chart.
Condition (2)
A condition is defined using greater than (>), less than (<), or equal to (=) operators. You can also specify a range using the following syntax:
-
(Value X:Value Y)interval with round brackets means from value X to value Y, non-inclusive. -
[Value X:Value Y]interval with square brackets means from value X to value Y inclusive.
The colon (:) is required. Using any other separator will prevent the condition from being applied.
Indication (3)
4 indicator types are available: font, fill, dots, or chart.
Color (4)
The standard color picker allows you to select a color from the palette or enter a custom color value.
You can also set the condition color to transparent. In this case, any series that meets the condition will be visually hidden. This is useful for scenarios when Trim cannot be used.
Highlight takes priority over conditional formatting. If applied, the condition color will be overridden by the highlight color.
You can create multiple conditions. They are applied sequentially, in the order in which they are defined.