
Groups & Teams in User Management
In the User Panel, you can see two types of user memberships:
Groups
Teams
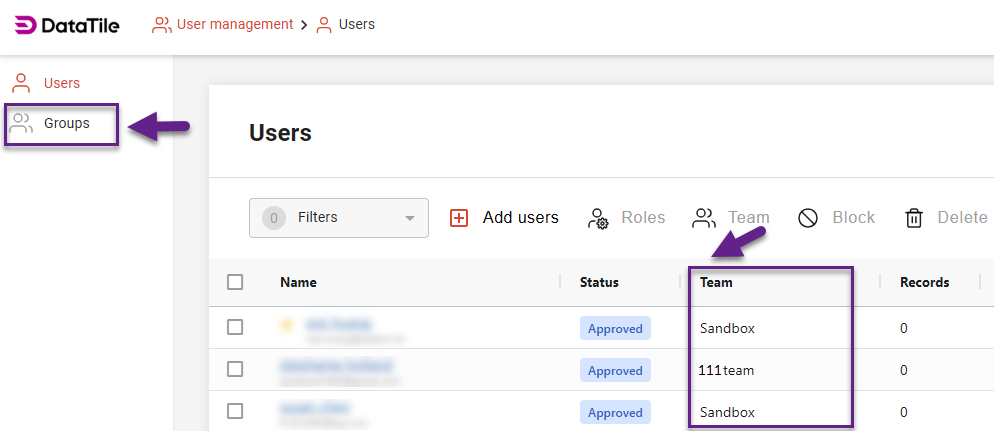
Teams
Each user on the server is assigned to one team.
By default, this will be the team of the person who sent the invitation.
Teams are designed to simplify billing management.
You can:
Organize users into teams;
Assign quotas to each team.
This feature is primarily for agencies working with multiple clients.
It helps attribute DataTile costs to specific projects or clients.
Groups
Users can belong to multiple groups simultaneously.
Groups are used for access management. After creating a group in the User Management panel, you can add users to it and use the group to share an entity with all its members at once.
Grouping makes it easier to track and manage user access.
To grant access rights to groups, the Supervisor or Syndicate Manager role is required.
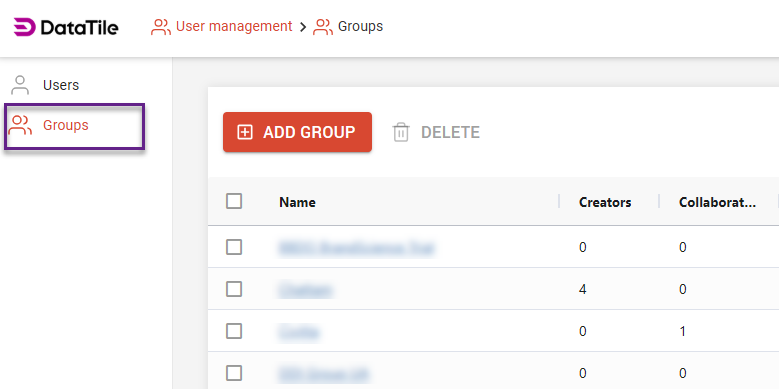
To create a new group, go to the User Management panel and select the Groups tab.
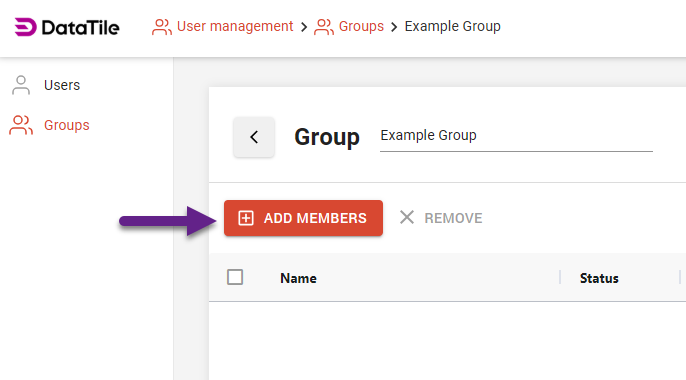
To add users to a group:
Click the group name to open it.
Select Add Members.
Use the search bar to find and add users.
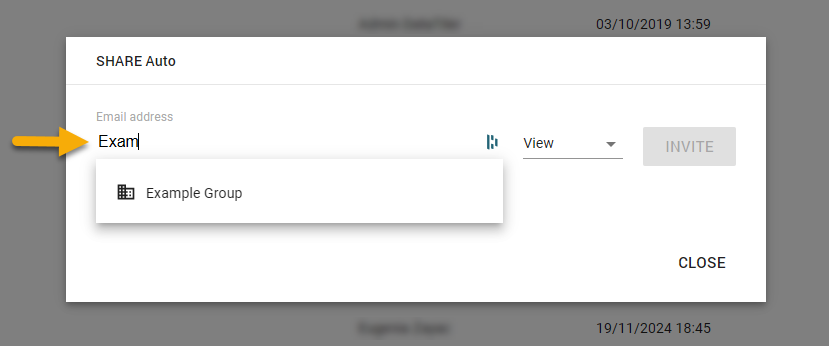
When groups are created, you can share an entity with them by entering the group name instead of an email. The system will recognize and match the group automatically.
Automatic Groups
The system includes virtual automatic groups:
All Users – all authenticated users, regardless of their role.
All Supervisors – all users with the Supervisor role.
When managing access to dashboard tabs, you can also create groups.
These are completely different entities and are not related to the groups described in this article.